
如何在给定参数曲线的某一点上绘制法例
如何在给定参数曲线的某一点上绘制法例
提问于 2019-04-17 08:45:23
,我想在一个特定的点( t_0 = 2*sp.pi/5 )画一条曲线的法线。
曲线由参数方程x(t) = sin(3t)和y(y) = sin(4t)给出,其中t0,2pi。对于这类参数曲线,用下列方程给出了法线的参数方程:
企图:
import sympy as sp
import matplotlib as mpl
import matplotlib.pyplot as plt
%matplotlib notebook

t,t_0 = sp.symbols('t t_0',real=True)
r_x = sp.sin(3*t)
diff_r_x = sp.diff(r_x, t)
r_y = sp.sin(4*t)#typo has been edited
diff_r_y = sp.diff(r_y, t)

para_eqx = r_x.subs(t, t_0) + diff_r_x.subs(t, t_0)*(t-t_0)#paremeter eq. of the normal defined
para_eqy = r_y.subs(t, t_0) - diff_r_x.subs(t, t_0)*(t-t_0)#paremeter eq. of the normal defined

r_x_normal = para_eqx.subs(t_0, 2*sp.pi/5)#plugging in t_0 = 2*sp.pi/5
r_y_normal = para_eqy.subs(t_0, 2*sp.pi/5)#plugging in t_0 = 2*sp.pi/5

t_range_normal = np.linspace(0, 250, 100) #from here on I have no clear idea on what is wrong.

xmarks = sp.lambdify(t, r_x_normal, "numpy")(t_range_normal)
ymarks = sp.lambdify(t, r_y_normal, "numpy")(t_range_normal)

fig, ax = plt.subplots(1)
complete_curve = ax.plot(xmarks, ymarks, ":", color="grey", alpha=0.5)
piece_of_curve = ax.plot(xmarks[:51], ymarks[:51], color="blue")
ax.plot(xmarks[50], ymarks[50], "o", color="blue")

plt.show()
我正在为t(由t_range_normal给出)的值来计算这些方程。我使用lambdify,然后用一条蓝线绘制图形上的正常值。
然而,我得到:
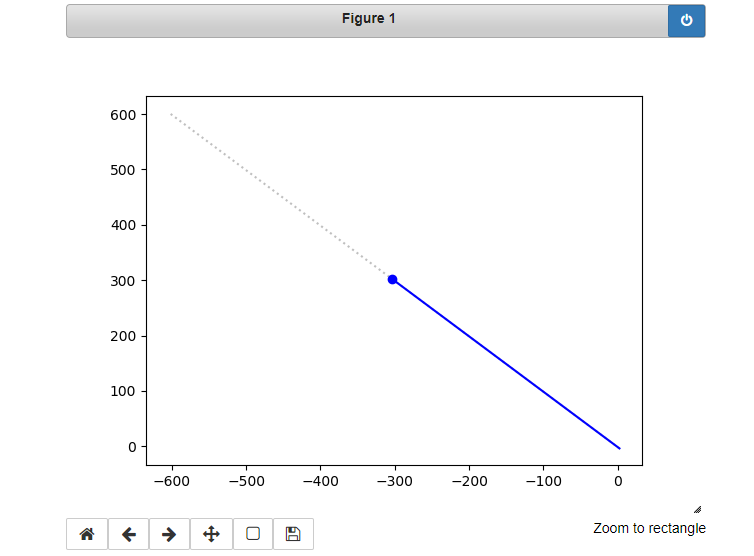
这是不正确的。我一定是从t_range_normal = np.linspace(0,250,100)中遗漏了什么.
谢谢。
回答 1
Stack Overflow用户
回答已采纳
发布于 2019-04-17 09:54:11
下面是您的代码,让我们一步一步地看一下:
import numpy as np
import sympy as sp
import matplotlib as mpl
import matplotlib.pyplot as plt

t,t_0 = sp.symbols('t t_0',real=True)
r_x = sp.sin(3*t)
diff_r_x = sp.diff(r_x, t)
r_y = sp.sin(4*t)
diff_r_y = sp.diff(r_y, t)r_x_eq= r_x.subs(t, t_0)
r_y_eq = r_y.subs(t, t_0)
r_x_eq
Out: sin(3*t_0)
r_y_eq
Out: sin(4*t_0)
r_x_eq.subs(t_0, 2*sp.pi/5)
Out: -sqrt(-sqrt(5)/8 + 5/8)
r_y_eq.subs(t_0, 2*sp.pi/5)
Out: -sqrt(-sqrt(5)/8 + 5/8)这是正确的,因为你在单位圆周围做了一个完整的循环,sin(0) = sin(360) = sin(720)等等。
参数函数的第二个项对于x和y是相同的(但有相反的符号)(根据您在问题中发布的数字):
para_eqx = r_x.subs(t, t_0) + diff_r_x.subs(t, t_0)*(t-t_0)#paremeter eq. for the normal defined
para_eqy = r_y.subs(t, t_0) - diff_r_x.subs(t, t_0)*(t-t_0)#paremeter eq. for the normal defined
因此,您的两个职能是:
r_x_normal = para_eqx.subs(t_0, 2*sp.pi/5)#plugging in t_0 = 2*sp.pi/5
r_x_normal
Out[:]: 3*(-sqrt(5)/4 - 1/4)*(t - 2*pi/5) - sqrt(-sqrt(5)/8 + 5/8)

r_y_normal = para_eqy.subs(t_0, 2*sp.pi/5)#plugging in t_0 = 2*sp.pi/5
r_y_normal
Out[:]: -3*(-sqrt(5)/4 - 1/4)*(t - 2*pi/5) - sqrt(sqrt(5)/8 + 5/8)因此,对于每个给定的t,它们只会以一个常量项来区别。
t_range_normal = np.linspace(0, 250, 100) #from here on I have no clear idea on what is wrong.

xmarks = sp.lambdify(t, r_x_normal, "numpy")(t_range_normal)
ymarks = sp.lambdify(t, r_y_normal, "numpy")(t_range_normal)

fig, ax = plt.subplots(1)
complete_curve = ax.plot(xmarks, ymarks, ":", color="grey", alpha=0.5)
piece_of_curve = ax.plot(xmarks[:51], ymarks[:51], color="blue")
ax.plot(xmarks[50], ymarks[50], "o", color="blue")

plt.show()页面原文内容由Stack Overflow提供。腾讯云小微IT领域专用引擎提供翻译支持
原文链接:
https://stackoverflow.com/questions/55723461
复制相关文章
相似问题
腾讯云开发者

Copyright © 2013 - 2026 Tencent Cloud. All Rights Reserved. 腾讯云 版权所有
深圳市腾讯计算机系统有限公司 ICP备案/许可证号:粤B2-20090059 ![]() 粤公网安备44030502008569号
粤公网安备44030502008569号
腾讯云计算(北京)有限责任公司 京ICP证150476号 | 京ICP备11018762号