
如何在文本下添加一行
如何在文本下添加一行
提问于 2019-04-08 19:49:31
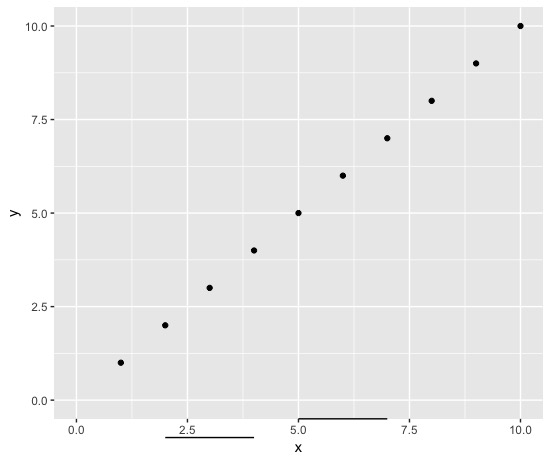
我想添加一对横线在ggplot底部,以说明x轴元素的分组。看起来,geom_abline和geom_segment都会在图形中添加行。知道怎么在下面加线吗?
p + geom_segment(aes(x = 2, y = -0.5, xend = 4, yend = -0.5 )) +
        geom_segment(aes(x = 5, y = -0.5, xend = 7, yend = -0.5))
这将绘制不在轴标题下的绘图图中的线段。
回答 1
Stack Overflow用户
回答已采纳
发布于 2019-04-08 20:01:05
您可以通过使用coord_cartesian(xlim, ylim, clip="off"),然后通过适当的geom使用annotate(),在绘图区域之外进行注释。根据您对分组的美学要求,您可以将线条放置在绘图区域的底部或轴标签的下方。
library(ggplot2)

df <- data.frame(x=seq(1,10), y=seq(1,10))

ggplot(df, aes(x,y)) +
  geom_point() +
  coord_cartesian(xlim=c(0,10), ylim=c(0,10), clip="off") +
  annotate("segment", x = 2, xend = 4, y = -1, yend = -1) +
  annotate("segment", x = 5, xend = 7, y = -0.5, yend = -0.5)
页面原文内容由Stack Overflow提供。腾讯云小微IT领域专用引擎提供翻译支持
原文链接:
https://stackoverflow.com/questions/55580769
复制相关文章
相似问题
腾讯云开发者

Copyright © 2013 - 2026 Tencent Cloud. All Rights Reserved. 腾讯云 版权所有
深圳市腾讯计算机系统有限公司 ICP备案/许可证号:粤B2-20090059  粤公网安备44030502008569号
腾讯云计算(北京)有限责任公司 京ICP证150476号 | 京ICP备11018762号