
24小时内按正态分布分配负荷,中午达到高峰?
我正试图在一天中的每一个小时内不均匀地分配一个负载,在中午左右进行高峰处理,这时会有更多的人可用。基本上,我想要一个任务的“正态分布”,就像一个简单的n / 24 = hourly load。
我们的目标是,大部分工作需要在一天中分配,早早和深夜的工作量较少。
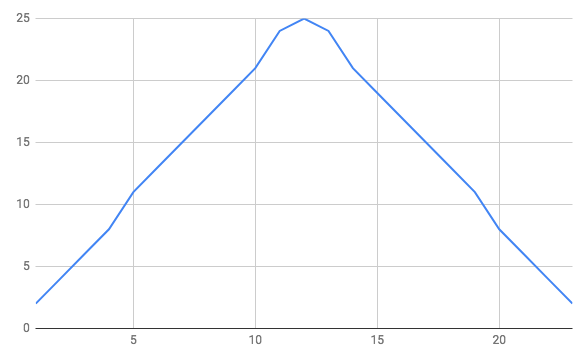
这就是我所得到的关于曲线的东西。
// Number per day
const numberPerDay = 600;
const numberPerHour = numberPerDay / 24;

let total = 0;
for (let hour = 1; hour < 24; hour++) {
  // Normal Distribution should be higher at 12pm / noon
  // This Inverse bell-curve is higher at 1am and 11pm
  const max = Math.min(24 - hour, hour);
  const min = Math.max(hour, 24 - hour);
  const penalty = Math.max(1, Math.abs(max - min));

  const percentage = Math.floor(100 * ((penalty - 1) / (24 - 1)));
  const number = Math.floor(numberPerHour - (numberPerHour * percentage / 100));

  console.log(`hour: ${hour}, penalty: ${penalty}, number: ${number}`);
  total += number;
}

console.log('Expected for today:', numberPerDay);
console.log('Actual for today:', total);小提琴现场直播。
产生了这样的东西:
回答 2
Stack Overflow用户
发布于 2019-04-02 21:58:11
您需要实现一个高斯函数。以下链接可能会有所帮助:https://math.stackexchange.com/questions/1236727/the-x-y-coordinates-for-points-on-a-bell-curve-normal-distribution
你需要选择你的均值和标准差(西格玛)。下面是我找到的一个片段:
//taken from Jason Davies science library
// https://github.com/jasondavies/science.js/
function gaussian(x) {
    var gaussianConstant = 1 / Math.sqrt(2 * Math.PI),
    mean = 0,
    sigma = 1;
    x = (x - mean) / sigma;
    return gaussianConstant * Math.exp(-.5 * x * x) / sigma;
};
https://gist.github.com/phil-pedruco/88cb8a51cdce45f13c7e
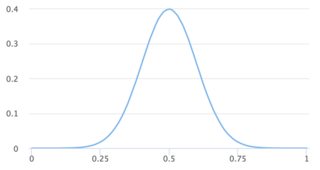
为了让它达到0-24,你将平均值设为12,并调整西格玛,以便根据你的需要将曲线展开。您还需要缩放一下"y“值。
更新
我已经为你创建了一个JS Fiddle,它规划了我认为你需要的东西。https://jsfiddle.net/arwmxc69/2/
var data = [];
var scaleFactor = 600
        mean = 12,
        sigma = 4;

function gaussian(x) {
    var gaussianConstant = 1 / Math.sqrt(2 * Math.PI);
    x = (x - mean) / sigma;
    return gaussianConstant * Math.exp(-.5 * x * x) / sigma;
};

for(x=0;x<24;x+=1) {
    var y = gaussian(x)
    data.push({x:x,y:y*scaleFactor});
}Stack Overflow用户
发布于 2019-04-05 06:59:00
我想你对近似值没意见。在这种情况下,类似于y=sin(pi*x)^4的解决方案可能是一个相对好(且容易)的解决方案。然后,通过将y提高到接近1的功率,可以使这种分布更宽或更细。
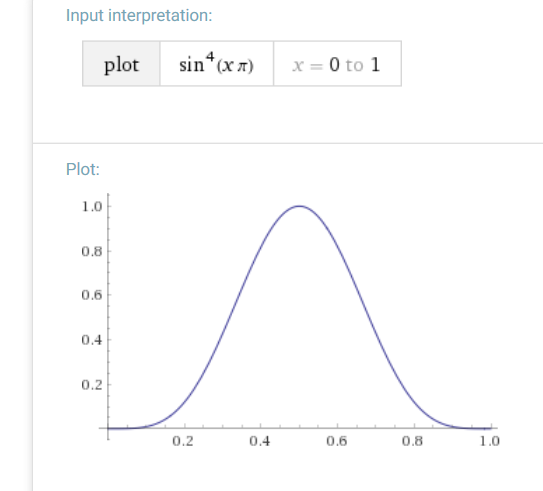
而且,它是循环的,所以通过执行以下的操作来帮助实现
y = (sin(pi*hour/24))^4扩大规模以适应600个工作岗位。
https://stackoverflow.com/questions/55483990
复制相似问题
腾讯云开发者

Copyright © 2013 - 2026 Tencent Cloud. All Rights Reserved. 腾讯云 版权所有
深圳市腾讯计算机系统有限公司 ICP备案/许可证号:粤B2-20090059 ![]() 粤公网安备44030502008569号
粤公网安备44030502008569号
腾讯云计算(北京)有限责任公司 京ICP证150476号 | 京ICP备11018762号