
x.x格式科学风格y-ticks matplotlib
x.x格式科学风格y-ticks matplotlib
提问于 2019-03-27 10:14:35
我正在使用matplotlib创建一些情节。
对于我使用style='sci'和scilimits=(0,0)的绘图
以下是代码:
for key in urbs_values.keys():
    # y-Axis (values)
    u[key] = np.array(urbs_values[key])
    o[key] = np.array(oemof_values[key])

    # draw plots
    plt.plot(i, u[key], label='urbs_'+str(key), linestyle='None', marker='x')
    plt.ticklabel_format(axis='y', style='sci', scilimits=(0, 0))
    plt.plot(i, o[key], label='oemof_'+str(key), linestyle='None', marker='.')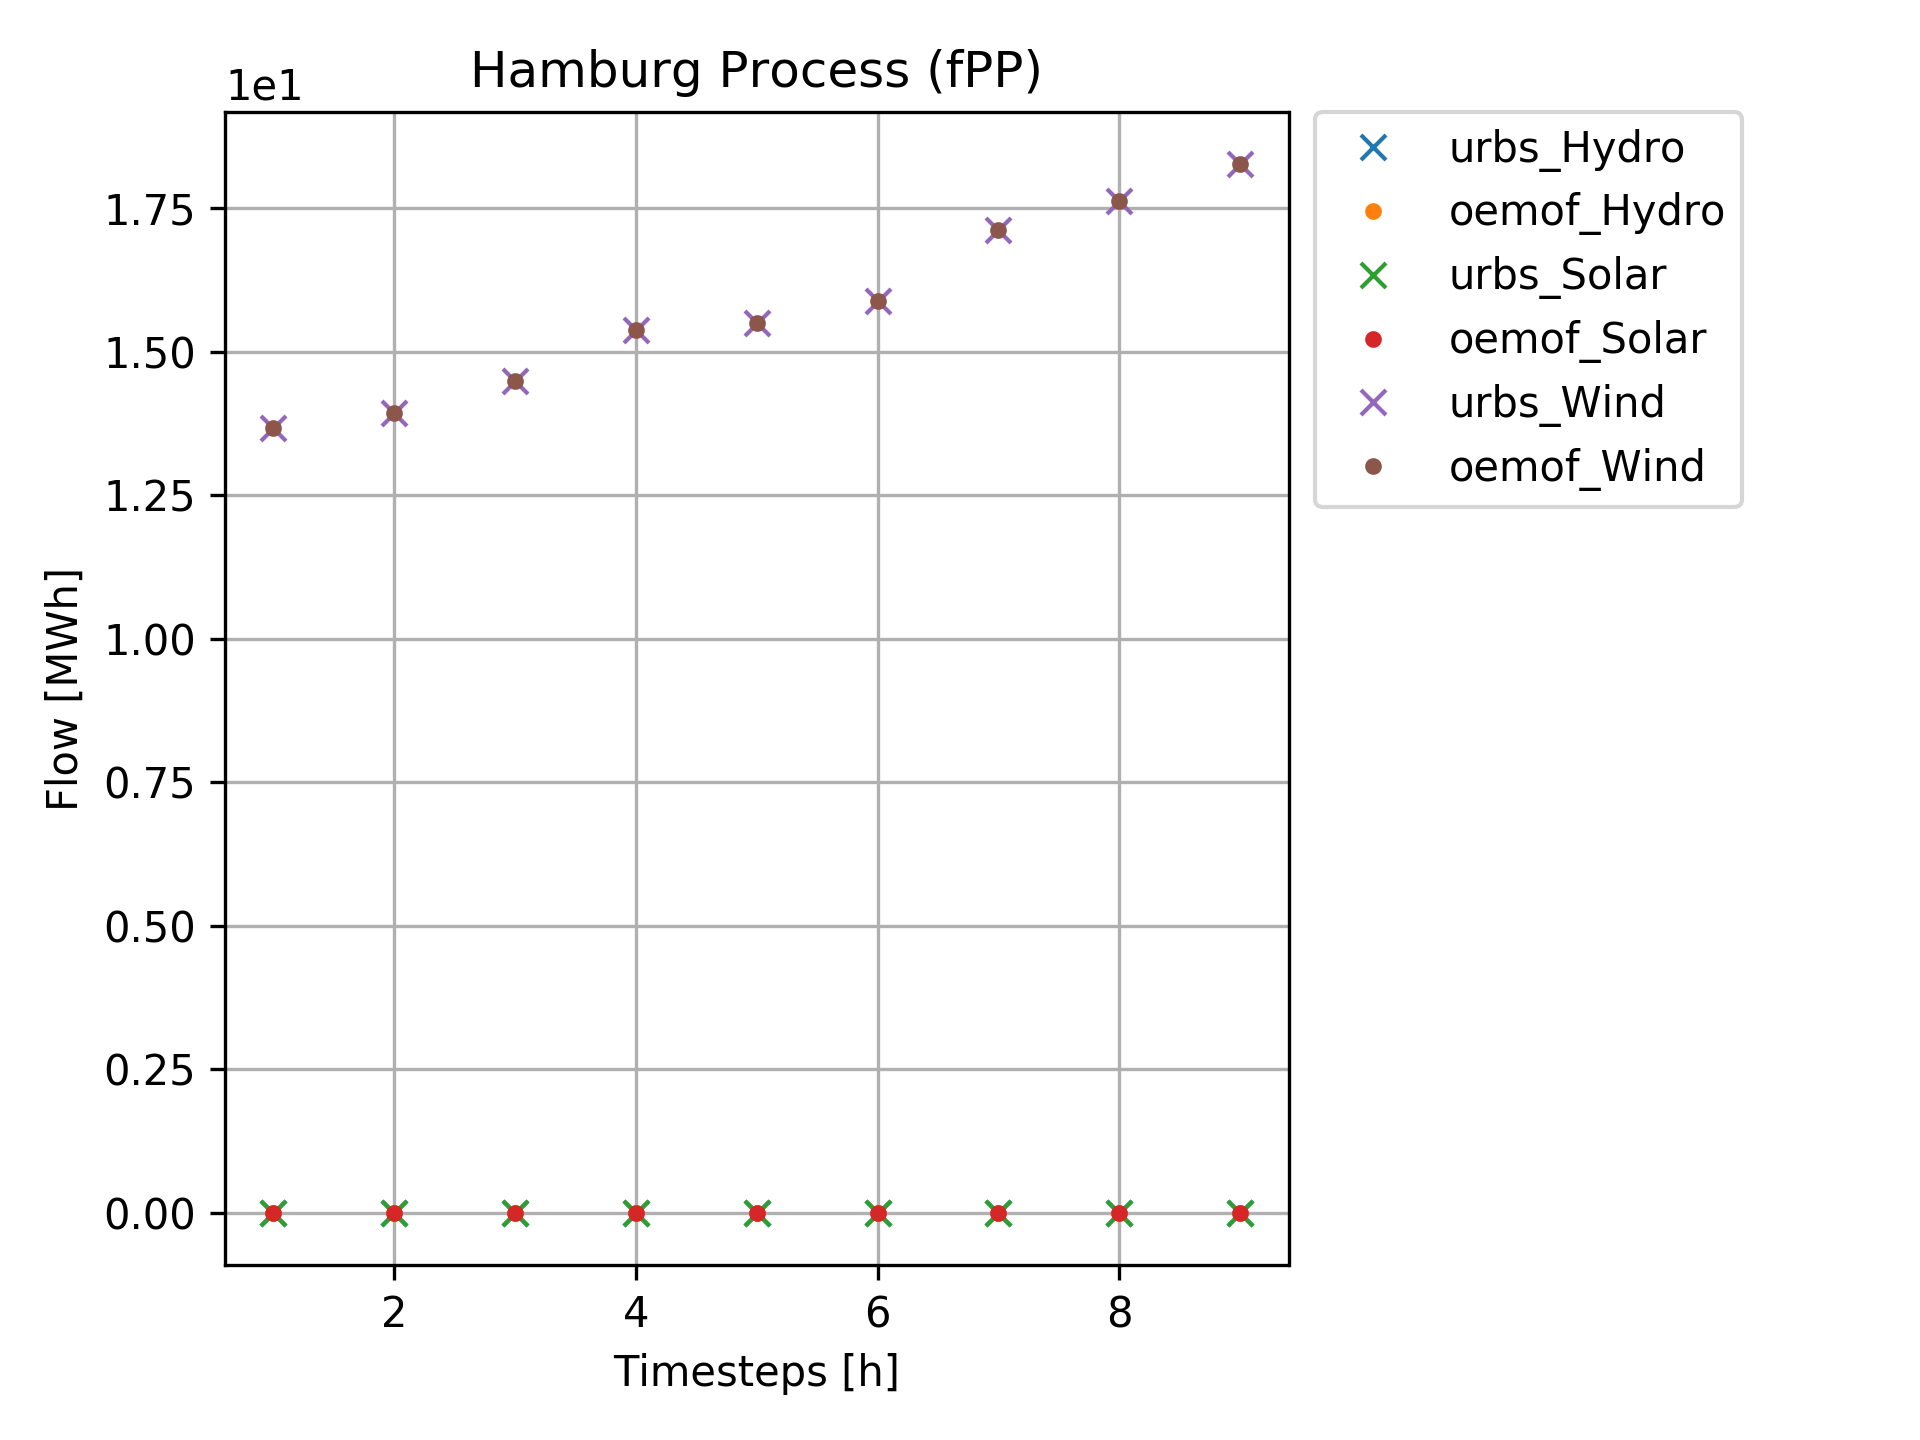
plt.ticklabel_format(axis='y', style='sci', scilimits=(0, 0))这通常是一致的,但有时我在y轴上得到x.x格式的值,有时我得到x.xx,但我并不觉得它很优雅。
是否有一种方法可以强制matplotlib通过动态缩放科学表示法来给出像x.x 这样的格式的y值?
下面是一个我不喜欢的例子:
回答 1
Stack Overflow用户
回答已采纳
发布于 2019-03-27 10:40:43
可以根据数据中的最大值动态设置限制:
def grabMaxExponent(values, precision=1):
    """Given a list of numericals, returns the exponent of the max
    value in scientific notation, adjusted to have no sig figs in
    decimal places.

    e.g. 190 > 1.9E+02 > 19E+01
    returns exponent (1)"""

    # Grab max value and convert to scientific notation
    value = format(max(values), f"5.{precision}E")

    # Pull exponent
    a,m = value.split('E+')
    a,b = a.split('.')
    a,b,m = map(int, (a,b,m))

    # If significant figures non-zero, increase exponent to bring them before decimal point
    if b > 0:
        m-=precision

    return m

m = grabMaxExponent(y)

# Set scilimits to m
plt.ticklabel_format(axis='y', style='sci', scilimits=(m,m))页面原文内容由Stack Overflow提供。腾讯云小微IT领域专用引擎提供翻译支持
原文链接:
https://stackoverflow.com/questions/55374712
复制相关文章
相似问题
腾讯云开发者

Copyright © 2013 - 2026 Tencent Cloud. All Rights Reserved. 腾讯云 版权所有
深圳市腾讯计算机系统有限公司 ICP备案/许可证号:粤B2-20090059 ![]() 粤公网安备44030502008569号
粤公网安备44030502008569号
腾讯云计算(北京)有限责任公司 京ICP证150476号 | 京ICP备11018762号