
使用自定义图像的三维散射图
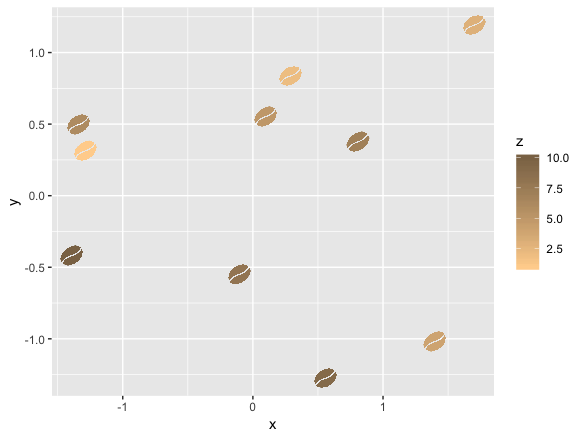
我试图使用ggplot和ggimage创建一个带有自定义图像的三维散点图。它在2D中工作得很好:
library(ggplot2)
library(ggimage)
library(rsvg)

set.seed(2017-02-21)
d <- data.frame(x = rnorm(10), y = rnorm(10), z=1:10,
  image = 'https://image.flaticon.com/icons/svg/31/31082.svg'
)

ggplot(d, aes(x, y)) +
  geom_image(aes(image=image, color=z)) +
  scale_color_gradient(low='burlywood1', high='burlywood4')
我尝试过两种创建三维图表的方法:
- 策略--尽管它是作为未来的请求排队的,但它目前不适用于geom_image。
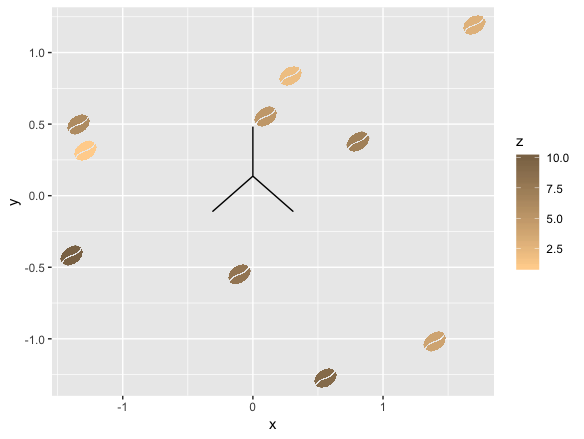
- gg3D -这是一个R包,但我不能让它发挥良好的自定义图像。下面是如何组合这些库的结果:
library(ggplot2)
library(ggimage)
library(gg3D)

ggplot(d, aes(x=x, y=y, z=z, color=z)) +
  axes_3D() +
  geom_image(aes(image=image, color=z)) +
  scale_color_gradient(low='burlywood1', high='burlywood4')
任何帮助都将不胜感激。如果有解决方案,我可以使用python库、javascript等。
回答 1
Stack Overflow用户
发布于 2019-04-01 13:33:06
这是一个非常粗略的答案,并没有完全解决你的问题,但我相信这是一个好的开始,其他人可能会发现这一点,并达成一个很好的解决方案。
有一种方法可以将图像放置为python中的custmo标记。从 answer开始,稍微摆弄一下盒子。
然而,这个解决方案的问题是,您的图像不是矢量化的(而且太大了,不能用作标记)。
此外,我没有测试一种根据颜色图对其着色的方法,因为它并没有真正显示为输出:/。
这里的基本思想是在创建地块之后用自定义图像替换标记。为了正确地将它们放置在图中,我们在ImportanceOfBeingErnest的答案后面检索适当的坐标。
from mpl_toolkits.mplot3d import Axes3D
from mpl_toolkits.mplot3d import proj3d
import matplotlib.pyplot as plt
from matplotlib import offsetbox
import numpy as np
请注意,我在这里下载了图像,并将其从本地文件中导入。
import matplotlib.image as mpimg
#
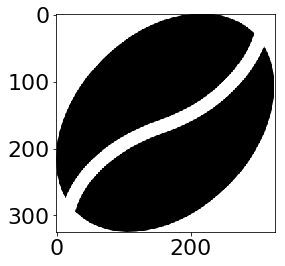
img=mpimg.imread('coffeebean.png')
imgplot = plt.imshow(img)
from PIL import Image
from resizeimage import resizeimage
with open('coffeebean.png', 'r+b') as f:
with Image.open(f) as image:
cover = resizeimage.resize_width(image, 20,validate=True)
cover.save('resizedbean.jpeg', image.format)
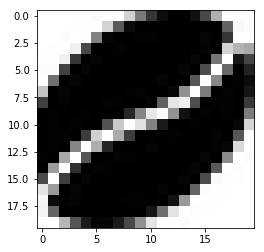
img=mpimg.imread('resizedbean.jpeg')
imgplot = plt.imshow(img)调整大小并不真正有效(或者至少,我找不到一种方法让它工作)。
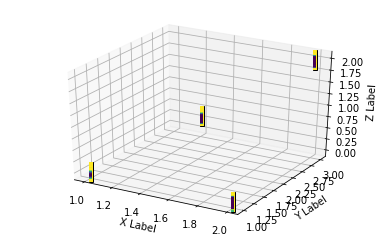
xs = [1,1.5,2,2]
ys = [1,2,3,1]
zs = [0,1,2,0]
#c = #I guess copper would be a good colormap here


fig = plt.figure()
ax = fig.add_subplot(111, projection=Axes3D.name)

ax.scatter(xs, ys, zs, marker="None")

# Create a dummy axes to place annotations to
ax2 = fig.add_subplot(111,frame_on=False)
ax2.axis("off")
ax2.axis([0,1,0,1])

class ImageAnnotations3D():
    def __init__(self, xyz, imgs, ax3d,ax2d):
        self.xyz = xyz
        self.imgs = imgs
        self.ax3d = ax3d
        self.ax2d = ax2d
        self.annot = []
        for s,im in zip(self.xyz, self.imgs):
            x,y = self.proj(s)
            self.annot.append(self.image(im,[x,y]))
        self.lim = self.ax3d.get_w_lims()
        self.rot = self.ax3d.get_proj()
        self.cid = self.ax3d.figure.canvas.mpl_connect("draw_event",self.update)

        self.funcmap = {"button_press_event" : self.ax3d._button_press,
                        "motion_notify_event" : self.ax3d._on_move,
                        "button_release_event" : self.ax3d._button_release}

        self.cfs = [self.ax3d.figure.canvas.mpl_connect(kind, self.cb) \
                        for kind in self.funcmap.keys()]

    def cb(self, event):
        event.inaxes = self.ax3d
        self.funcmap[event.name](event)

    def proj(self, X):
        """ From a 3D point in axes ax1,
            calculate position in 2D in ax2 """
        x,y,z = X
        x2, y2, _ = proj3d.proj_transform(x,y,z, self.ax3d.get_proj())
        tr = self.ax3d.transData.transform((x2, y2))
        return self.ax2d.transData.inverted().transform(tr)

    def image(self,arr,xy):
        """ Place an image (arr) as annotation at position xy """
        im = offsetbox.OffsetImage(arr, zoom=2)
        im.image.axes = ax
        ab = offsetbox.AnnotationBbox(im, xy, xybox=(0., 0.),
                            xycoords='data', boxcoords="offset points",
                            pad=0.0)
        self.ax2d.add_artist(ab)
        return ab

    def update(self,event):
        if np.any(self.ax3d.get_w_lims() != self.lim) or \
                        np.any(self.ax3d.get_proj() != self.rot):
            self.lim = self.ax3d.get_w_lims()
            self.rot = self.ax3d.get_proj()
            for s,ab in zip(self.xyz, self.annot):
                ab.xy = self.proj(s)


ia = ImageAnnotations3D(np.c_[xs,ys,zs],img,ax, ax2 )

ax.set_xlabel('X Label')
ax.set_ylabel('Y Label')
ax.set_zlabel('Z Label')
plt.show()
你可以看到输出远远不是最优的。然而,图像的位置是正确的。用一个矢量化的咖啡豆代替静态的咖啡豆,也许能做到这一点。
附加信息
试图使用cv2 (每一种插值方法)来调整大小,都没有帮助。
无法在当前工作站上尝试skimage。
您可以尝试下面的方法,看看结果如何。
from skimage.transform import resize
res = resize(img, (20, 20), anti_aliasing=True)

imgplot = plt.imshow(res)https://stackoverflow.com/questions/55308428
复制相似问题
腾讯云开发者

Copyright © 2013 - 2026 Tencent Cloud. All Rights Reserved. 腾讯云 版权所有
深圳市腾讯计算机系统有限公司 ICP备案/许可证号:粤B2-20090059 ![]() 粤公网安备44030502008569号
粤公网安备44030502008569号
腾讯云计算(北京)有限责任公司 京ICP证150476号 | 京ICP备11018762号