
运行任意python代码的Bokeh hovertools
我正在使用Bokeh尝试创建一个图形,当用户“悬停”时,它的数据点将在悬停工具中显示另一个图形,显示关于该数据点的附加信息(也就是说,在主图中,数据点是集合间隔上时间序列的平均值,我希望悬停工具显示该间隔中的所有数据)。
用户指南 (下面复制的完整代码)提供了一个解决方案:使用自定义的HTMLTool技巧来引用文件中的数字。然而,这将要求我创建文件中的所有数字(可能高达10,000)以供参考。这是太大的时间开销,所以我希望有一个更好的解决方案。也就是说:悬停工具是否有可能动态运行python代码,从而能够交互地显示数据的图形?
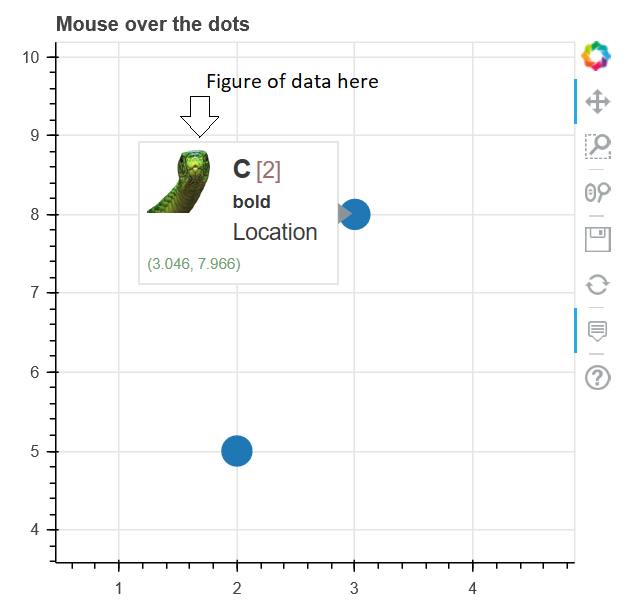
(示例图像,取自用户指南,代码如下)
下面的代码是在2019年3月19日从 bokeh用户指南 复制的。
from bokeh.plotting import figure, output_file, show, ColumnDataSource

output_file("toolbar.html")

source = ColumnDataSource(data=dict(
    x=[1, 2, 3, 4, 5],
    y=[2, 5, 8, 2, 7],
    desc=['A', 'b', 'C', 'd', 'E'],
imgs=[
    'http://docs.bokeh.org/static/snake.jpg',
    'http://docs.bokeh.org/static/snake2.png',
    'http://docs.bokeh.org/static/snake3D.png',
     'http://docs.bokeh.org/static/snake4_TheRevenge.png',
    'http://docs.bokeh.org/static/snakebite.jpg'
],
fonts=[
    '<i>italics</i>',
    '<pre>pre</pre>',
    '<b>bold</b>',
    '<small>small</small>',
    '<del>del</del>'
]
))

TOOLTIPS = """
<div>
    <div>
        <img
            src="@imgs" height="42" alt="@imgs" width="42"
            style="float: left; margin: 0px 15px 15px 0px;"
            border="2"
        ></img>
    </div>
    <div>
        <span style="font-size: 17px; font-weight: bold;">@desc</span>
        <span style="font-size: 15px; color: #966;">[$index]</span>
    </div>
    <div>
        <span>@fonts{safe}</span>
    </div>
    <div>
        <span style="font-size: 15px;">Location</span>
        <span style="font-size: 10px; color: #696;">($x, $y)</span>
    </div>
</div>
"""

p = figure(plot_width=400, plot_height=400, tooltips=TOOLTIPS,
       title="Mouse over the dots")

p.circle('x', 'y', size=20, source=source)

show(p)
回答 1
Stack Overflow用户
发布于 2019-03-19 17:18:01
您只能在Bokeh服务器应用程序中使用Python回调。似乎不可能对一个HoverTool使用Python回调(它必须始终是一个JS回调,否则就会得到这个错误:ValueError: expected an instance of type Callback, got <function callback at 0x114fdbb90> of type function)。
下面的解决方案使用JS回调,它在主图上盘旋圆圈时显示了一个小的“工具提示图”(Bokehv1.0.4工作,并且只有在Bokeh文档中有两个情节时才会这样做):
from bokeh.plotting import figure, show
from bokeh.layouts import gridplot, Row
from bokeh.models import ColumnDataSource, CDSView, BooleanFilter, CustomJS, BoxSelectTool, HoverTool
import pandas as pd

data = {'x': [1, 2, 3],
        'y':[1, 2, 3],
        'xs':[[9, 8, 7], [6, 5, 4], [3, 2, 1]],
        'ys':[[29, 28, 29], [27, 28, 27], [25, 25, 20]]}
source = ColumnDataSource(data)
plot = figure(title = 'PLOT IN HOVER TOOLTIP', tools = '')
circles = plot.circle('x', 'y', size = 20, source = source)

plot_tooltip = figure(name = 'plot_tooltip', plot_width = 200, plot_height = 200, x_axis_location = None, y_axis_location = None, title = None, tools = 'hover', tooltips = [("x", "@x"), ("y", "@y")], toolbar_location = None)
lines = plot_tooltip.line('x', 'y', source = ColumnDataSource({'x': [], 'y': []}))
circles2 = plot_tooltip.circle('x', 'y', source = ColumnDataSource({'x': [], 'y': []}))

code = """
var indices = cb_data.index['1d'].indices;
if (indices.length > 0){
    if(plot_tooltip.x_range.bounds == null)
    {
        Bokeh.documents[0].add_root(plot_tooltip)
    }
    const idx = indices[0]
    lines.data_source.data['x'] = source.data['xs'][idx]
    lines.data_source.data['y'] = source.data['ys'][idx]
    lines.data_source.change.emit();

    circles.data_source.data['x'] = source.data['xs'][idx]
    circles.data_source.data['y'] = source.data['ys'][idx]
    circles.data_source.change.emit();

    div = document.getElementsByClassName('bk-root')[1];
    div.style = "position:absolute; left:" + cb_data.geometry['sx'] + "px; top:" + cb_data.geometry['sy'] + "px;";
} """

callback = CustomJS(args = dict(source = source, lines = lines, circles = circles2, plot_tooltip = plot_tooltip), code = code)

hover = HoverTool()
hover.callback = callback
hover.tooltips = None
hover.renderers = [circles]
plot.add_tools(hover)

show(plot)
结果:
https://stackoverflow.com/questions/55244088
复制相似问题
腾讯云开发者

Copyright © 2013 - 2026 Tencent Cloud. All Rights Reserved. 腾讯云 版权所有
深圳市腾讯计算机系统有限公司 ICP备案/许可证号:粤B2-20090059 ![]() 粤公网安备44030502008569号
粤公网安备44030502008569号
腾讯云计算(北京)有限责任公司 京ICP证150476号 | 京ICP备11018762号