
整齐-Python不能捕获极值。
我用整洁-Python来模拟正则正弦函数的过程,基于曲线与0的绝对差。配置文件几乎完全是从基本XOR示例中采用的,但被设置为1的输入数量除外。偏移量的方向是在实际预测步骤之后从原始数据中推断出来的,所以这实际上是关于在[0, 1]范围内预测偏移量。
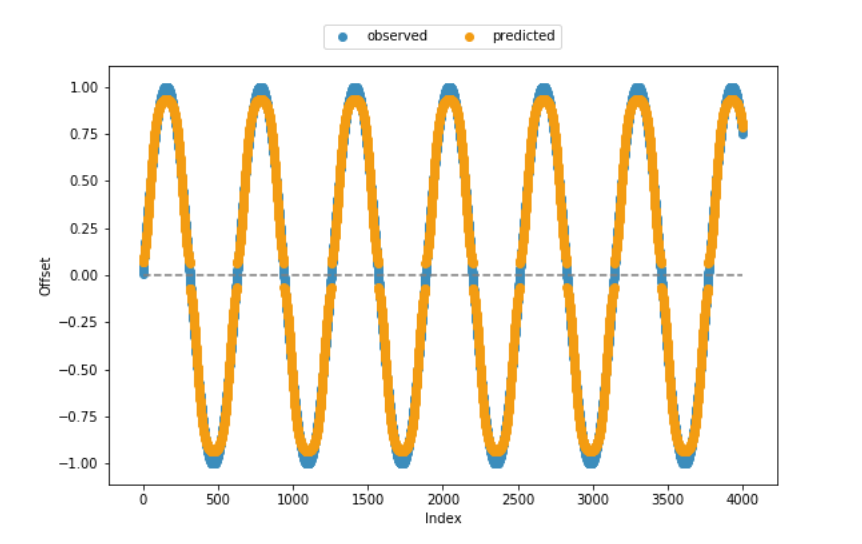
适应度函数和大部分剩余代码也是从帮助页面中采用的,这就是为什么我非常确信从技术角度来看,代码是一致的。从下面包含的观察到的和预测的偏移量的可视化中可以看出,模型在大多数情况下都创造了相当好的结果。但是,它无法捕获值范围的下限和上端。
任何关于如何提高算法性能的帮助,特别是在下/上边缘,将是非常感谢的。或者说,到目前为止,我还没有考虑到任何有条理的限制?
位于当前工作目录中的config-feedforward:
#--- parameters for the XOR-2 experiment ---#

[NEAT]
fitness_criterion     = max
fitness_threshold     = 3.9
pop_size              = 150
reset_on_extinction   = False

[DefaultGenome]
# node activation options
activation_default      = sigmoid
activation_mutate_rate  = 0.0
activation_options      = sigmoid

# node aggregation options
aggregation_default     = sum
aggregation_mutate_rate = 0.0
aggregation_options     = sum

# node bias options
bias_init_mean          = 0.0
bias_init_stdev         = 1.0
bias_max_value          = 30.0
bias_min_value          = -30.0
bias_mutate_power       = 0.5
bias_mutate_rate        = 0.7
bias_replace_rate       = 0.1

# genome compatibility options
compatibility_disjoint_coefficient = 1.0
compatibility_weight_coefficient   = 0.5

# connection add/remove rates
conn_add_prob           = 0.5
conn_delete_prob        = 0.5

# connection enable options
enabled_default         = True
enabled_mutate_rate     = 0.01

feed_forward            = True
initial_connection      = full

# node add/remove rates
node_add_prob           = 0.2
node_delete_prob        = 0.2

# network parameters
num_hidden              = 0
num_inputs              = 1
num_outputs             = 1

# node response options
response_init_mean      = 1.0
response_init_stdev     = 0.0
response_max_value      = 30.0
response_min_value      = -30.0
response_mutate_power   = 0.0
response_mutate_rate    = 0.0
response_replace_rate   = 0.0

# connection weight options
weight_init_mean        = 0.0
weight_init_stdev       = 1.0
weight_max_value        = 30
weight_min_value        = -30
weight_mutate_power     = 0.5
weight_mutate_rate      = 0.8
weight_replace_rate     = 0.1

[DefaultSpeciesSet]
compatibility_threshold = 3.0

[DefaultStagnation]
species_fitness_func = max
max_stagnation       = 20
species_elitism      = 2

[DefaultReproduction]
elitism            = 2
survival_threshold = 0.2
整洁函数:
# . fitness function ----

def eval_genomes(genomes, config):
  for genome_id, genome in genomes:
    genome.fitness = 4.0
    net = neat.nn.FeedForwardNetwork.create(genome, config)
    for xi in zip(abs(x)):
      output = net.activate(xi)
      genome.fitness -= abs(output[0] - xi[0]) ** 2


# . neat run ----

def run(config_file, n = None):
  # load configuration
  config = neat.Config(neat.DefaultGenome, neat.DefaultReproduction,
                       neat.DefaultSpeciesSet, neat.DefaultStagnation,
                       config_file)
  # create the population, which is the top-level object for a NEAT run
  p = neat.Population(config)
  # add a stdout reporter to show progress in the terminal
  p.add_reporter(neat.StdOutReporter(True))
  stats = neat.StatisticsReporter()
  p.add_reporter(stats)
  p.add_reporter(neat.Checkpointer(5))
  # run for up to n generations
  winner = p.run(eval_genomes, n)
  return(winner)
代码:
### ENVIRONMENT ====

### . packages ----

import os
import neat

import numpy as np
import matplotlib.pyplot as plt
import random


### . sample data ----

x = np.sin(np.arange(.01, 4000 * .01, .01))


### NEAT ALGORITHM ====

### . model evolution ----

random.seed(1899)
winner = run('config-feedforward', n = 25)


### . prediction ----

## extract winning model
config = neat.Config(neat.DefaultGenome, neat.DefaultReproduction,
                     neat.DefaultSpeciesSet, neat.DefaultStagnation,
                     'config-feedforward')

winner_net = neat.nn.FeedForwardNetwork.create(winner, config)

## make predictions
y = []
for xi in zip(abs(x)):
  y.append(winner_net.activate(xi))

## if required, adjust signs
for i in range(len(y)):
  if (x[i] < 0):
    y[i] = [x * -1 for x in y[i]]

## display sample vs. predicted data
plt.scatter(range(len(x)), x, color='#3c8dbc', label = 'observed') # blue
plt.scatter(range(len(x)), y, color='#f39c12', label = 'predicted') # orange
plt.hlines(0, xmin = 0, xmax = len(x), colors = 'grey', linestyles = 'dashed')
plt.xlabel("Index")
plt.ylabel("Offset")
plt.legend(bbox_to_anchor = (0., 1.02, 1., .102), loc = 10,
           ncol = 2, mode = None, borderaxespad = 0.)
plt.show()
plt.clf()
回答 1
Stack Overflow用户
发布于 2019-04-01 09:57:57
There有不同的实现,因此细节可能会有所不同。
通常整洁的处理偏见,包括一个特殊的输入神经元,总是活跃(后激活1)。我怀疑bias_max_value和bias_min_value决定了这个偏置神经元和隐藏神经元之间的最大允许连接强度。在我使用的整洁的代码中,这两个参数并不存在,偏置到隐藏的连接被视为正常(在我们的例子中,它们有自己允许的范围-5到5)。
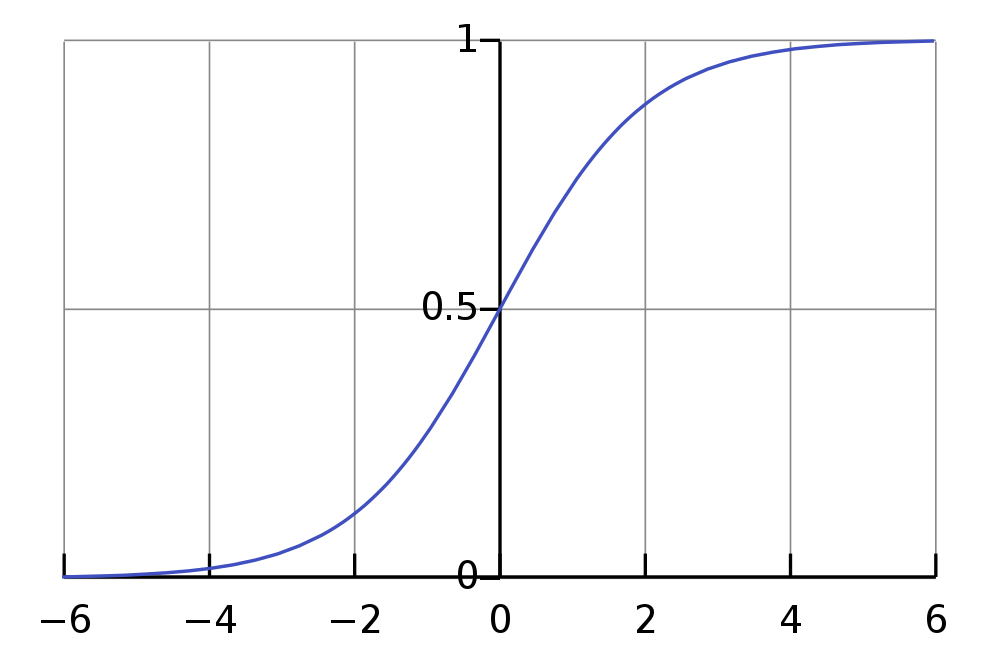
如果您正在使用Sigmoid函数,您的输出神经元将在0到1的范围内工作(考虑对隐藏神经元(可能是RELU)进行更快的激活)。
如果你正试图预测接近0或1的值,这是一个问题,因为你真的需要把你的神经元推到它们的范围的极限,而Sigmoid渐近地(慢慢地)接近这些极值:
幸运的是,有一种非常简单的方法可以查看这是否是问题所在:简单地调整输出的规模!有点像
out = raw_out * 1.2 - 0.1这将允许您的理论输出在超出预期输出的范围内(在我的示例中为-0.1到1.1 ),而达到0和1将更容易(实际上严格来说是可能的)。
https://stackoverflow.com/questions/55243619
复制相似问题
腾讯云开发者

Copyright © 2013 - 2026 Tencent Cloud. All Rights Reserved. 腾讯云 版权所有
深圳市腾讯计算机系统有限公司 ICP备案/许可证号:粤B2-20090059 ![]() 粤公网安备44030502008569号
粤公网安备44030502008569号
腾讯云计算(北京)有限责任公司 京ICP证150476号 | 京ICP备11018762号