
使用voronoi在传单中创建surface_polygons,用点数据创建合唱图
使用voronoi在传单中创建surface_polygons,用点数据创建合唱图
提问于 2019-03-18 18:17:26
我有个棘手的问题。
我正试图将一些数据可视化为一种“漂亮”的元数据浏览器。它是以下格式的基本点数据:
> print(tempdata[1:5, ])
  Station  Lat_dec  Long_dec Surface_T
1     247 50.33445 -2.240283     15.19
2     245 50.58483 -2.535217     14.11
3     239 50.16883 -2.509250     15.41
4     225 50.32848 -2.765967     15.34
5     229 50.63900 -2.964800     14.09
我可以使用Lat,Long和Temp创建以下voronoi多边形,并使用一个简单的框来剪辑它们,这样它们就不会永远扩展。
# Creating Stations
stations <- st_as_sf(df,
                     coords = c("Long_dec","Lat_dec")
                     )

# Create voronoi/thiessen polygons
v <- stations %>%
  st_union() %>%
  st_voronoi() %>%
  st_collection_extract()

# Creating boundary box
box <- st_bbox(stations) %>%
  st_as_sfc()

# Clipping voronoi to boundary box
hmm <- st_crop(v, box)
这会产生以下曲面多边形:
> str(hmm)
sfc_POLYGON of length 107; first list element: List of 1
 $ : num [1:7, 1:2] -7.23 -6.94 -6.95 -7.04 -7.24 ...
 - attr(*, "class")= chr [1:3] "XY" "POLYGON" "sfg"
作图为:
leaflet() %>%
  addPolygons(data = hmm) %>%
  addProviderTiles(providers$Esri.WorldTerrain)
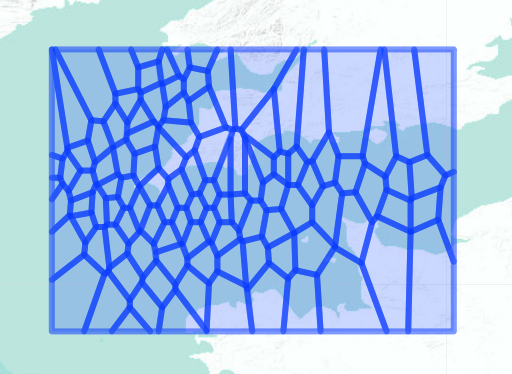
我想做的是,用温度给表面多边形涂上颜色,例如,温度越热越红等等。我已经尝试过所有的方法,典型的R崩溃。
我认为这与没有任何关于表面多边形的信息有关,比如站或者链接到原始数据的多边形ID号。
我很困惑,任何帮助都是很棒的!!
套餐:
library(sf)
library(dplyr)
library(rgdal)
library(leaflet)
最新情况:
> tempdata[1:10, ]
   Station  Lat_dec  Long_dec Surface_T
1      247 50.33445 -2.240283     15.19
2      245 50.58483 -2.535217     14.11
3      239 50.16883 -2.509250     15.41
4      225 50.32848 -2.765967     15.34
5      229 50.63900 -2.964800     14.09
6      227 50.33757 -3.303217     15.12
7      217 50.16657 -3.563817     15.13
8      207 49.66683 -3.556550     15.04
9      213 50.16512 -3.824667     14.97
10     219 49.83707 -3.815483     14.78

stations <- st_as_sf(tempdata,
                     coords = c("Long_dec","Lat_dec"))

test <- st_sample(stations,
                  size = as.numeric(count(tempdata))
                  )


join <- st_sf("temp" = stations$Surface_T, geometry = test) 回答 1
Stack Overflow用户
回答已采纳
发布于 2019-03-19 08:03:45
对我来说也是新的。以前从没和沃罗诺瓦共事过。但问题确实在于,您的stations dataframe在st_union()中失去了它的所有特性。
仅仅加上它似乎是不可行的,因为多边形的顺序与以前的点的顺序不一样。因此,空间连接可能是一个很好的解决办法。
使用我自己的示例数据:
library(sf)
library(leaflet)
#will work with any polygon
samplepoints_sf <- st_sample(bw_polygon, size = 2000, type = "random", crs = st_crs(4326))[1:500]
# although coordinates are longitude/latitude, st_intersects assumes that they are planar
#create an sf-object like your example
bw_sf <- st_sf("some_variable" = sample(1:50, 500, replace = TRUE), geometry = samplepoints_sf)
#create the voronoi diagram, "some_variable" gets lost.
v <- bw_sf %>%
st_union() %>%
st_voronoi() %>%
st_collection_extract()
#do a spatial join with the original bw_sf data frame to get the data back
v_poly <- st_cast(v) %>%
st_intersection(bw_polygon) %>%
st_sf() %>%
st_join(bw_sf, join = st_contains)
#create a palette (many ways to do this step)
colors <- colorFactor(
palette = c("green", "yellow", "red"),
domain = (v_poly$some_variable)
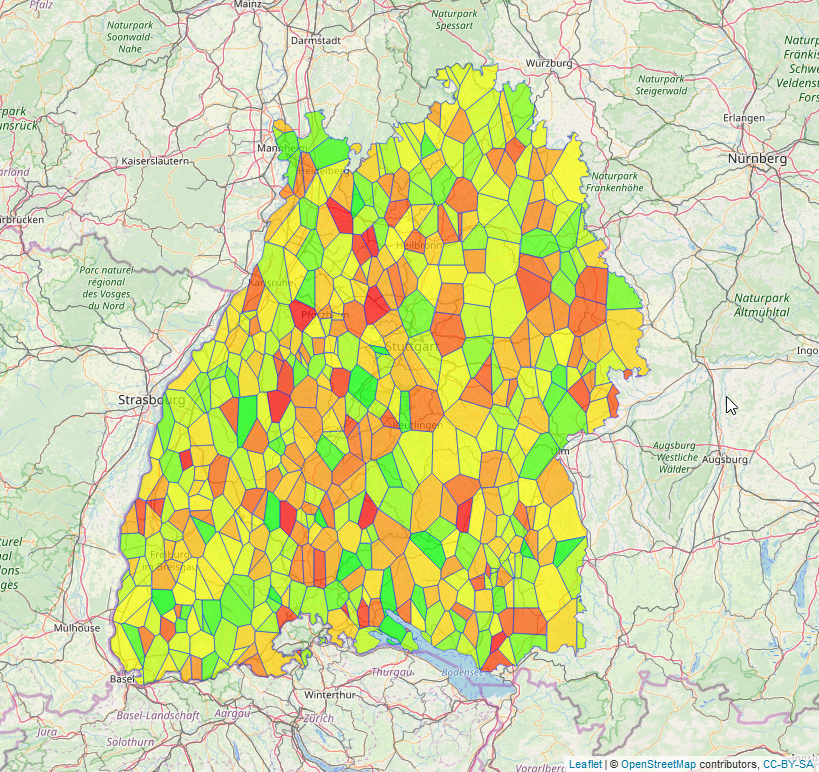
#create the leaflet
leaflet(v_poly) %>% addTiles() %>%
addPolygons(fillColor = colors(v_poly$some_variable),
fillOpacity = 0.7,
weight = 1,
popup = paste("<strong> some variable: </strong>",v_poly$some_variable))希望这对你有用。
页面原文内容由Stack Overflow提供。腾讯云小微IT领域专用引擎提供翻译支持
原文链接:
https://stackoverflow.com/questions/55227713
复制相关文章
相似问题
腾讯云开发者

Copyright © 2013 - 2026 Tencent Cloud. All Rights Reserved. 腾讯云 版权所有
深圳市腾讯计算机系统有限公司 ICP备案/许可证号:粤B2-20090059 ![]() 粤公网安备44030502008569号
粤公网安备44030502008569号
腾讯云计算(北京)有限责任公司 京ICP证150476号 | 京ICP备11018762号