
在日期列标题上使用melt()
在日期列标题上使用melt()
提问于 2019-03-16 13:37:31
下面是我的excel的样子。我想使用这些日期(x4中的列名"cols“)来绘制一个图。
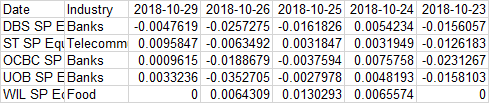
structure(list(Date = c("DBS SP Equity", "ST SP Equity", "OCBC SP Equity",
"UOB SP Equity", "WIL SP Equity"), Industry = c("Banks", "Telecommunications",
"Banks", "Banks", "Food"), `43402` = c(-0.00476190476190486,
0.00958466453674123, 0.000961538461538458, 0.00332363938512659,
0), `43399` = c(-0.0257275411218895, -0.00634920634920633, -0.0188679245283018,
-0.0352705410821643, 0.00643086816720251), `43398` = c(-0.0161825726141079,
0.00318471337579607, -0.00375939849624074, -0.00279776179056757,
0.0130293159609121), `43397` = c(0.00542344597413447, 0.00319488817891389,
0.00757575757575757, 0.00481927710843388, 0.00655737704918025
), `43396` = c(-0.0156057494866531, -0.0126182965299685, -0.0231267345050878,
-0.015810276679842, 0)), row.names = c(NA, -5L), class = c("tbl_df",
"tbl", "data.frame"))

data4 <- read_excel("data.xlsx", sheet = 4, col_names = TRUE)
    x4 <- melt(data4, id = c("Industry"), measure.vars = 3:997,  variable = "cols")
    print(x4$cols)
当我打印它时,这个值是整数No。
我试过了,但这是科尔斯的表演
x4$cols <- as.Date(x4$cols, format = "%yyyy-%mm-%dd")我还尝试了以下代码。它再次显示int no。
x4 <- x4 %>% mutate(Date = dmy(cols))我怎么才能得到真正的约会?
回答 1
Stack Overflow用户
回答已采纳
发布于 2019-03-16 13:56:54
实际日期是1970-01-01年的整数偏移量(原点).您可能会使用类似于as.Date(x4$cols, origin="1970-01-01")的内容进行转换。另见:https://stats.idre.ucla.edu/r/faq/how-does-r-handle-date-values/
页面原文内容由Stack Overflow提供。腾讯云小微IT领域专用引擎提供翻译支持
原文链接:
https://stackoverflow.com/questions/55197433
复制相关文章
相似问题
腾讯云开发者

Copyright © 2013 - 2026 Tencent Cloud. All Rights Reserved. 腾讯云 版权所有
深圳市腾讯计算机系统有限公司 ICP备案/许可证号:粤B2-20090059 ![]() 粤公网安备44030502008569号
粤公网安备44030502008569号
腾讯云计算(北京)有限责任公司 京ICP证150476号 | 京ICP备11018762号