
如何为值网格而不是直线生成序列?
如何为值网格而不是直线生成序列?
提问于 2019-03-15 06:14:08
序列需要
- `a0grid`  including increments of 100 between starting at 500 and up to 2500 [500,600,700,...,2200,2300,2400,2500]
- `a1grid` including increments of 10  between -100 and 100 [-100,-90,-80,...,80,90,100]
初始化:
a0 <- seq(500,2500,by=100)
a1 <- seq(-100,100,by=10)

 [1]  500  600  700  800  900 1000 1100 1200 1300 1400 1500 1600 1700 1800 1900 2000 2100 2200 2300 2400 2500
 [1] -100  -90  -80  -70  -60  -50  -40  -30  -20  -10    0   10   20   30   40   50   60   70   80   90  100
我现在得到的是:
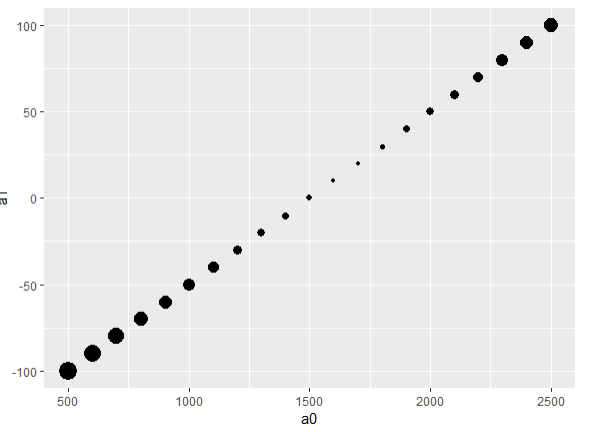
我正在寻找的东西(不完全准确,但只是到处都是点,如所示):
回答 1
Stack Overflow用户
回答已采纳
发布于 2019-03-15 06:22:33
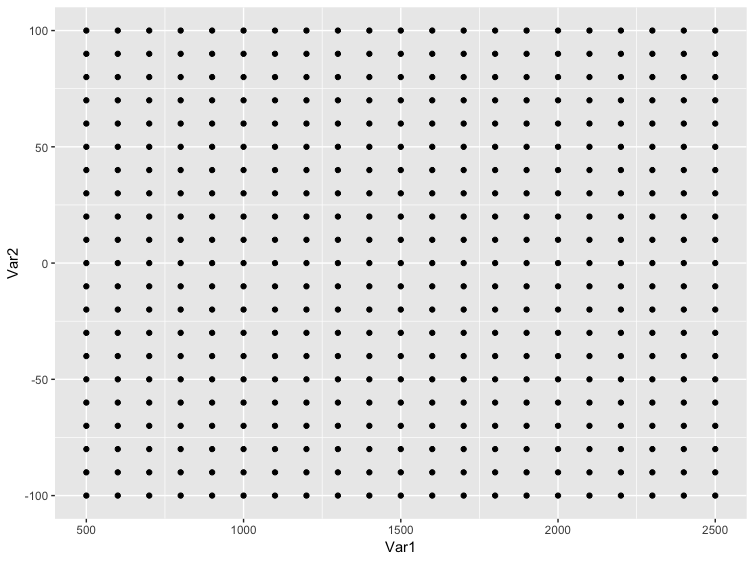
如果你想到处找点的话,你可以使用expand.grid
library(ggplot2)

ggplot(expand.grid(a0, a1)) +
    geom_point(aes(x=Var1,y=Var2))
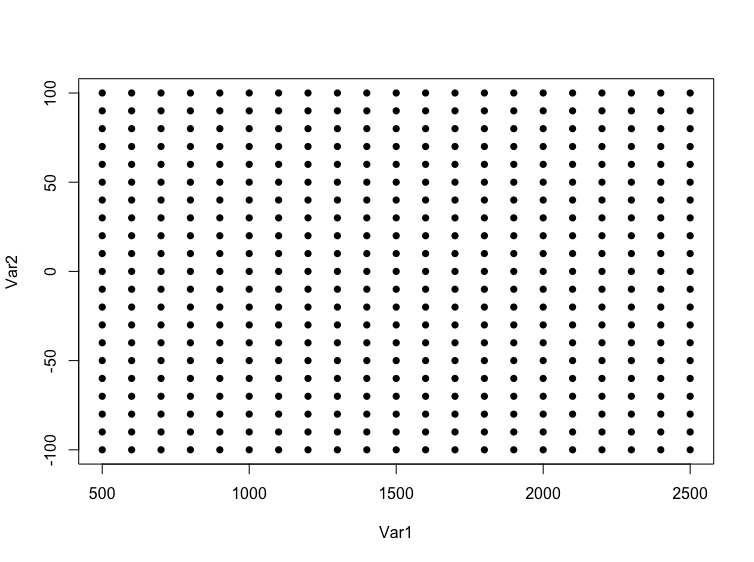
这个阴谋也可以在没有任何包的情况下完成。
plot(expand.grid(a0, a1), pch = 16)
页面原文内容由Stack Overflow提供。腾讯云小微IT领域专用引擎提供翻译支持
原文链接:
https://stackoverflow.com/questions/55176614
复制相关文章
相似问题
腾讯云开发者

Copyright © 2013 - 2026 Tencent Cloud. All Rights Reserved. 腾讯云 版权所有
深圳市腾讯计算机系统有限公司 ICP备案/许可证号:粤B2-20090059 ![]() 粤公网安备44030502008569号
粤公网安备44030502008569号
腾讯云计算(北京)有限责任公司 京ICP证150476号 | 京ICP备11018762号