
基于正相关的矩阵细分变量构建综合指标
我的目标是建立一个综合指标。在进行加权和聚合规则(如经合组织综合指标编制手册中所描述的)之前,一个重要步骤是查看指标之间的相关性。
请注意,同一集合的不同度量之间几乎总是存在某种正相关关系。因此,应该引入一个经验法则来定义一个阈值,超过这个阈值,相关性就是重复计数的症状。
为了继续这样做(即只选择具有一定相关阈值的正指标),我尝试了以下方法--下面的例子
df <- data.frame(
indic1 = c(0, 0, 0, 0, 0, 0, 0, 1, 0, 0, 0, 0, 0, 1, 0),
indic2 = c(0.28571, 0.5714285, 0.4285714, 0.142857, 0.285714, 1, 0.71428, 0.14285, 0.5714, 0.142, 0, 0.14285, 0.8571, 0.8571427, 0.4285),
indic3 = c(0, 0, 0, 0, 0, 0, 1, 0, 0, 0, 0, 0, 0, 0, 0),
indic4 = c(0, 0, 0, 0, 0, 0, 1, 0, 0, 0, 1, 0, 0, 1, 0),
indic5 = c(0, 0, 1, 0, 0, 1, 1, 1, 0, 0, 0, 0, 1, 1, 0.5),
indic6 = c(0, 1, 0, 0, 0, 1, 0, 0, 0, 0, 0, 1, 1, 0, 0),
indic7 = c(0.5, 0.5, 1, 0.5, 0.5, 0.5, 0.5, 0, 1, 1, 1, 0.5, 1, 0.5, 0),
indic8 = c(0, 0, 0.3333, 1, 0.3333, 0.3333, 0.3333, 1, 0, 0.3333, 0.3333, 0.3333, 0, 0, 1),
indic9 = c(0, 0, 0, 0, 0, 0, 0, 1, 0, 0, 1, 1, 0, 0, 1),
indic10 = c(0, 0.2, 1, 0.2, 0.8, 0.4, 0, 0.4, 0.4, 0.8, 0.4, 0.6, 0.4, 0, 0.2),
indic11 = c(0, 0, 0, 0, 0, 0, 1, 0, 0, 0, 0, 0, 0, 0, 0),
indic12 = c(0.5, 0, 0, 0, 1, 0, 0, 1, 0, 0, 0.5, 0, 0, 0, 0),
indic13 = c(1, 0, 0, 0, 0, 0, 1, 1, 0, 0, 0, 0, 1, 1, 0),
indic14 = c(0, 0, 0, 0, 0, 0, 1, 0, 0, 0, 1, 0, 0, 0, 0),
indic15 = c(1, 0, 0, 0, 0, 0, 0, 0, 0, 0, 1, 0, 0, 1, 1),
indic16 = c(1, 0, 0, 0, 0, 0, 0, 0, 1, 0, 1, 0, 0, 1, 1),
indic17 = c(0.3333, 0.3333, 0.6666, 0, 0.6666, 0.1666, 1, 0.3333, 0.8333, 0.5, 0.1666, 0.5, 0, 0.8333, 0.1666),
indic18 = c(0.857142, 0.428571, 0.85714, 0.142857, 0.714285, 0.5714, 0.714285, 0, 0.42857, 0.857142, 0, 0, 1, 0.2857, 0),
row.names = c("Area1", "Area2", "Area3", "Area4", "Area5", "Area6", "Area7", "Area8", "Area9", "Area10", "Area11", "Area12", "Area13", "Area14", "Area15"))
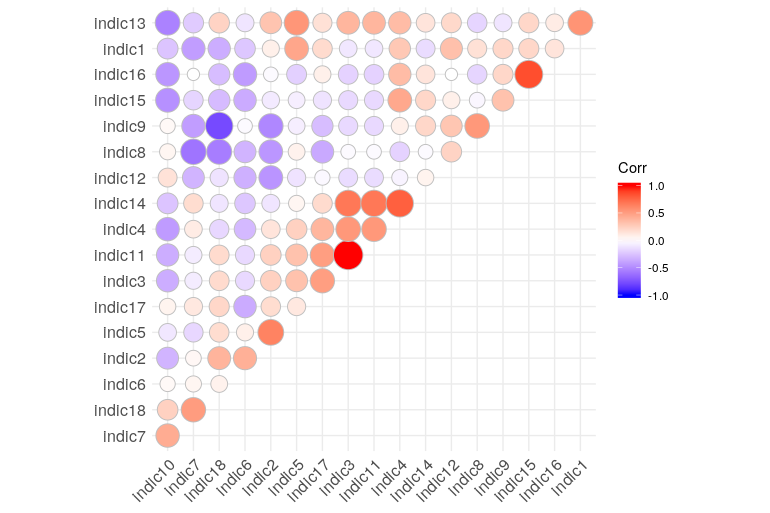
## now correlation matrix
corr.matrix <- cor(df, method = "pearson", use = "pairwise.complete.obs")
## Visualization with ggplot
ggcorrplot(corr.matrix ,
method = "circle",
hc.order = TRUE,
type = "upper")
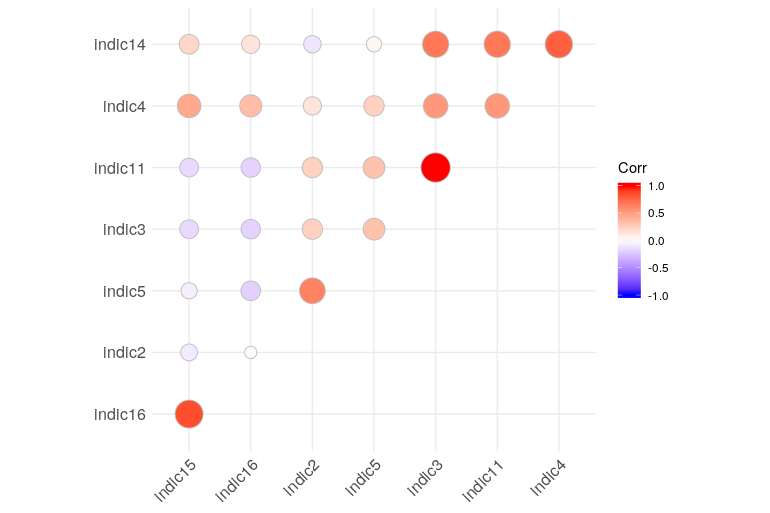
接下来是子集,特定阈值的相关矩阵(以下示例:R: Filter correlation matrix on values > and < )
所以守则是:
corr.matrix0 <- corr.matrix
diag(corr.matrix0) <- 0

##set up threshold
threshold <- 0.6

## Now subsetting but here without absolute value
#ok <- apply(abs(corr.matrix0) >= threshold, 1, any)
ok <- apply( corr.matrix0 >= threshold, 1, any)

## or
# ok <- sort(unique( c(which(abs(corr.matrix0) >= threshold, arr = TRUE))))
# ok <- sort(unique( c(which(corr.matrix0 >= threshold, arr = TRUE))))

corr.matrixnew <-  corr.matrix[ok, ok]
ggcorrplot(corr.matrixnew ,
           method = "circle",
           hc.order = TRUE,
           type = "upper")
但从结果中可以看出这是行不通的..。我还能看到一些负面的关联..。
我想应该有一个基于相关矩阵的优化过程--就像一种套索那样?
有人有这个剧本吗?或者我错过了什么..。
提前感谢!
回答 1
Stack Overflow用户
发布于 2019-03-12 10:52:30
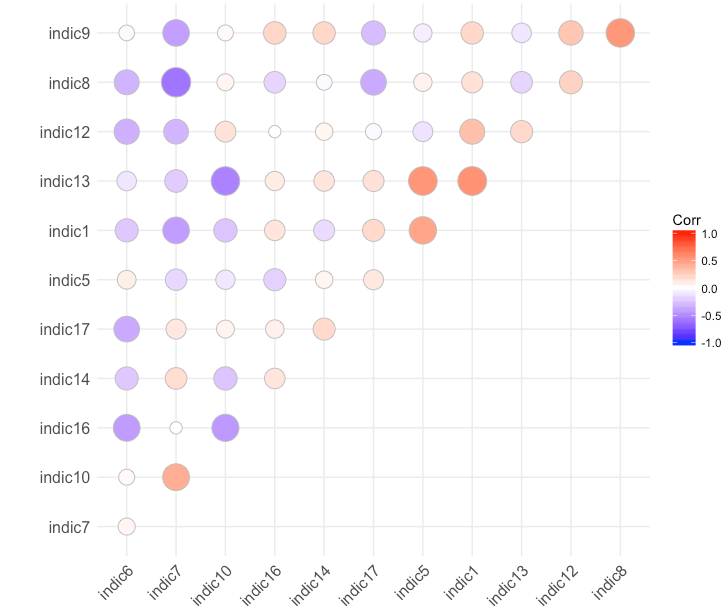
最简单的选择是使用来自findCorrelation的caret来实现它。它正是为这种情况而创建的。
# do it with cart
library(caret)
to_remove <- findCorrelation(corr.matrix, cutoff = threshold)

corr.matrix_2 <- cor(df[, -to_remove], method = "pearson",  use = "pairwise.complete.obs")

ggcorrplot(corr.matrix_2 ,
           method = "circle",
           hc.order = TRUE,
           type = "upper")
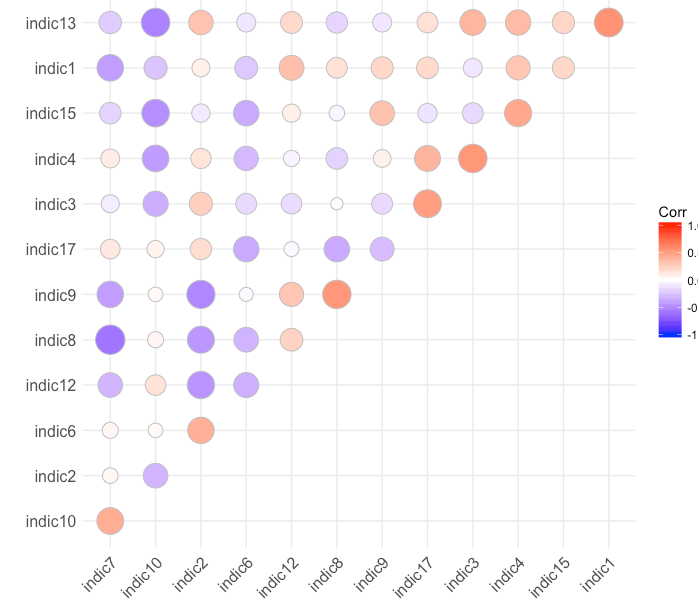
或者,您只需使用基本R就可以手动完成此操作:
# do it manually
df2 <- as.data.frame(corr.matrix)
df2[lower.tri(corr.matrix, diag = TRUE)] <- NA

to_remove_2 <- (which(sapply(df2,function(x) any(abs(x) > threshold, na.rm = TRUE))))

corr.matrix_3 <- cor(df[, -to_remove_2], method = "pearson",  use = "pairwise.complete.obs")

ggcorrplot(corr.matrix_3 ,
           method = "circle",
           hc.order = TRUE,
           type = "upper")
编辑:,我可能误解了你。我以为你想删除那些相关性>阈值。
但是,如果你想保留它们并移除其他人:
df2 <- as.data.frame(corr.matrix)
diag(df2) <- NA
to_keep <- (which(sapply(df2,function(x) any(x > threshold, na.rm = TRUE))))

corr.matrix_4 <- cor(df[, to_keep], method = "pearson",  use = "pairwise.complete.obs")

ggcorrplot(corr.matrix_4 ,
           method = "circle",
           hc.order = TRUE,
           type = "upper")
这可能仍然具有负相关性,因为,虽然变量的成对相关性很高,但它们之间的一些相互作用是负的。
例子:A到B> 0.6,C到D> 0.6,但A到C<0
如果你想让它们都高一点,那就不是成对的相关性了.
EDIT_2:
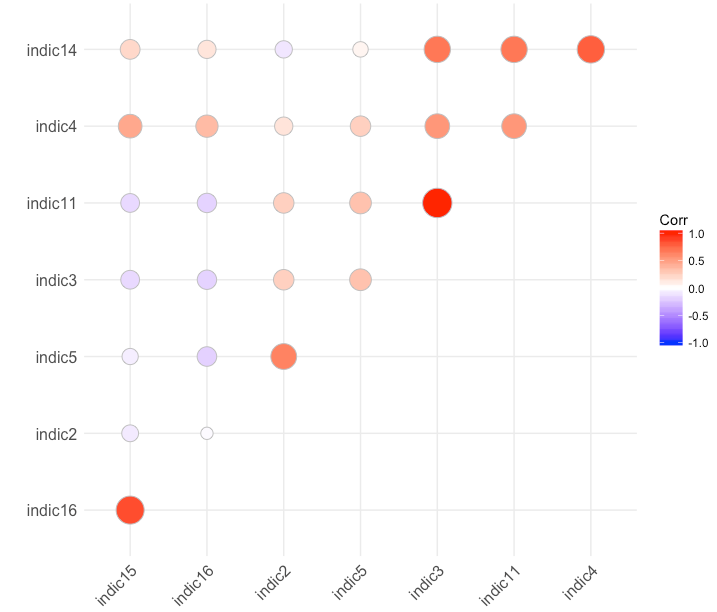
仅选择具有一定相关阈值的正向指标)
如果你只是为了绘图的目的而这么做:从相关矩阵中删除负数(或低于阈值的数字)并绘制它。
# corr.matrix_4[corr.matrix_4 <= 0] <- NA
corr.matrix_4[corr.matrix_4 <= threshold] <- NA


library(GGally)
# Using GGally here as ggcorrplot doesn't handle NAs
# Or do it manually: http://www.sthda.com/english/wiki/ggplot2-quick-correlation-matrix-heatmap-r-software-and-data-visualization

ggcorr(corr.matrix_4, cor_matrix = corr.matrix_4, labbel = TRUE)

https://stackoverflow.com/questions/55119027
复制相似问题
腾讯云开发者

Copyright © 2013 - 2026 Tencent Cloud. All Rights Reserved. 腾讯云 版权所有
深圳市腾讯计算机系统有限公司 ICP备案/许可证号:粤B2-20090059 ![]() 粤公网安备44030502008569号
粤公网安备44030502008569号
腾讯云计算(北京)有限责任公司 京ICP证150476号 | 京ICP备11018762号