
Chart.js -如何将标签值显示为X值和Y值的百分比--目前总是100%
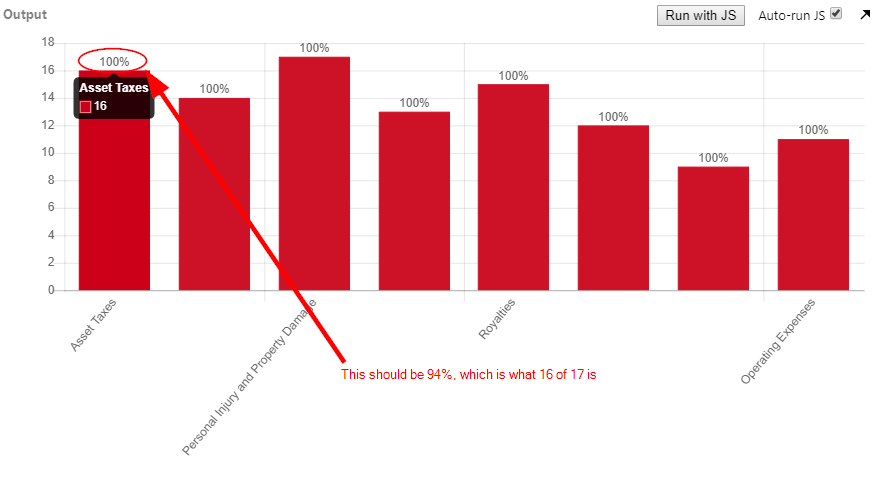
我正在使用Chart.js连同一个Chart.js插件,图表标签.我想在条形图的顶部显示标签,在标签中显示x值相对于y值的百分比(例如,16是17的94% ),但是标签值总是100% (似乎是16x =100计算16y )。
在没有插件的情况下,我还没有找到解决这个问题的方法,所以我不确定插件是否是问题所在,或者图表配置是否错误。
如有任何建议/帮助,我们将不胜感激!下面是一个包含代码的JSBin:https://jsbin.com/dawenetuya/edit?html,js,output
HTML和JS:
<div style="width: 100%;"><canvas id="myChart"></canvas></div>

var colors = '#cd1127';
var ctx = document.getElementById("myChart");
var myChart = new Chart(ctx, {
        type: 'bar',
        data: {
                labels: ["Asset Taxes", "Excluded Assets", "Personal Injury and Property Damage", "Offsite Disposal", "Royalties", "Litigation", "Employment", "Operating Expenses"],
                datasets: [{
                        data: [16, 14, 17, 13, 15, 12, 9, 11],
                        backgroundColor: '#cd1127',
                        borderColor: '#cd1127',
                        borderWidth: 1
                }]
        },
        options: {
            responsive: true,
            legend: {
                display: false
            },
            scales: {
                yAxes: [{
                    ticks: {
                        min: 0,
                        max: 18,
                        beginAtZero:true
                    }
                }]
            },
            plugins: {
                labels: {
                    render: 'percentage',
                    showActualPercentages: true
                }
            }
        }
});
这是一张截图,展示了我要做的事情:
回答 2
Stack Overflow用户
发布于 2019-02-28 23:52:18
您可以创建自己的呈现函数,如下所示:
...

render: function (args) {
  let max = 17; //This is the default 100% that will be used if no Max value is found
  try {
    //Try to get the actual 100% and overwrite the old max value
    max = Object.values(args.dataset.data).map((num) => {
      return +num; //Convert num to integer
    });
    max = Math.max.apply(null, max);
  } catch (e) {}
  return Math.round(args.value * 100 / max);
}

...下面是示例代码:https://jsbin.com/hihexutuyu/1/edit
您实际上可以擦除try/catch块,只定义max值,它就能工作了。看起来是这样的:
...

render: function (args) {
  let max = 17; //Custom maximum value

  return Math.round(args.value * 100 / max);
}

...try/catch块仅用于自动从数据集中获取最大值。
插件文档以及可以添加到render中的所有其他可能的设置都在这里:https://github.com/emn178/chartjs-plugin-labels。
Stack Overflow用户
发布于 2019-02-28 05:59:39
我不确定我是否完全掌握了您想要实现的目标,但是您可以使用回调函数沿yAxes生成所需的结果,类似于以下内容:
yAxes:[{
    ticks:{
        callback:function(value,index,values){
            return ((value / index) * 100)+'% ';
        }
    }
}]https://stackoverflow.com/questions/54916474
复制相似问题
腾讯云开发者

Copyright © 2013 - 2026 Tencent Cloud. All Rights Reserved. 腾讯云 版权所有
深圳市腾讯计算机系统有限公司 ICP备案/许可证号:粤B2-20090059  粤公网安备44030502008569号
腾讯云计算(北京)有限责任公司 京ICP证150476号 | 京ICP备11018762号