
如何将小波变换与频率滤波相结合
如何将小波变换与频率滤波相结合
提问于 2019-02-10 17:35:57
我需要对心电信号进行以下去噪:
- 用“db6”小波到9个层次的离散小波变换
- 在0-0.35Hz范围内的第9电平上过滤频率(而不是细节系数)。
- 仅使用3到9级来重建信号
我不知道如何在Python (PyWavelets)中执行第二步,因为我只能修改细节和近似系数,也不知道如何将它们与频率关联起来。
我该怎么做?
这是我的密码
    import pywt

    #DWT
    coeff = pywt.wavedec(data,'db6',level=9)

    #filter the 0-0.35Hz frequencies in the 9-th level?


    #reconstruct the signal
y = pywt.waverec( coeff[:8]+ [None] * 2, 'db6' )回答 1
Stack Overflow用户
回答已采纳
发布于 2019-02-14 03:20:49
我以前的答案(现在删除了)有点让人困惑。在这里,我将尝试提供一个亲手的例子,显示仅使用“db6”近似系数重建360 to采样的心电图数据,相当于使用0.35Hz的截止频率对这些数据进行低通滤波。
在下面的代码示例中,我从are (from scipy.misc import electrocardiogram)导入一个ECG时间序列;它们是在360 at时采样的,就像您的一样。我将使用以下方法过滤这些数据:
- 一种离散小波变换方法,即仅使用近似系数(filtered_data_dwt)重建数据。
- 巴特沃斯滤波器(filtered_data_butterworth)
下面是代码示例:
import pywt
import numpy as np
from scipy.misc import electrocardiogram
import scipy.signal as signal
import matplotlib.pyplot as plt

wavelet_type='db6'
data = electrocardiogram()

DWTcoeffs = pywt.wavedec(data,wavelet_type,mode='symmetric', level=9, axis=-1)

DWTcoeffs[-1] = np.zeros_like(DWTcoeffs[-1])
DWTcoeffs[-2] = np.zeros_like(DWTcoeffs[-2])
DWTcoeffs[-3] = np.zeros_like(DWTcoeffs[-3])
DWTcoeffs[-4] = np.zeros_like(DWTcoeffs[-4])
DWTcoeffs[-5] = np.zeros_like(DWTcoeffs[-5])
DWTcoeffs[-6] = np.zeros_like(DWTcoeffs[-6])
DWTcoeffs[-7] = np.zeros_like(DWTcoeffs[-7])
DWTcoeffs[-8] = np.zeros_like(DWTcoeffs[-8])
DWTcoeffs[-9] = np.zeros_like(DWTcoeffs[-9])

filtered_data_dwt=pywt.waverec(DWTcoeffs,wavelet_type,mode='symmetric',axis=-1)


fc = 0.35  # Cut-off frequency of the butterworth filter
w = fc / (360 / 2) # Normalize the frequency
b, a = signal.butter(5, w, 'low')
filtered_data_butterworth = signal.filtfilt(b, a, data)
让我们用这两种方法绘制原始数据和过滤数据的功率谱密度:
plt.figure(1)
plt.psd(data, NFFT=512, Fs=360, label='original data', color='blue')
plt.psd(filtered_data_dwt, NFFT=512, Fs=360, color='red', label='filtered data (DWT)')
plt.psd(filtered_data_butterworth, NFFT=512, Fs=360, color='black', label='filtered data (Butterworth)')
plt.legend()
产生的结果:
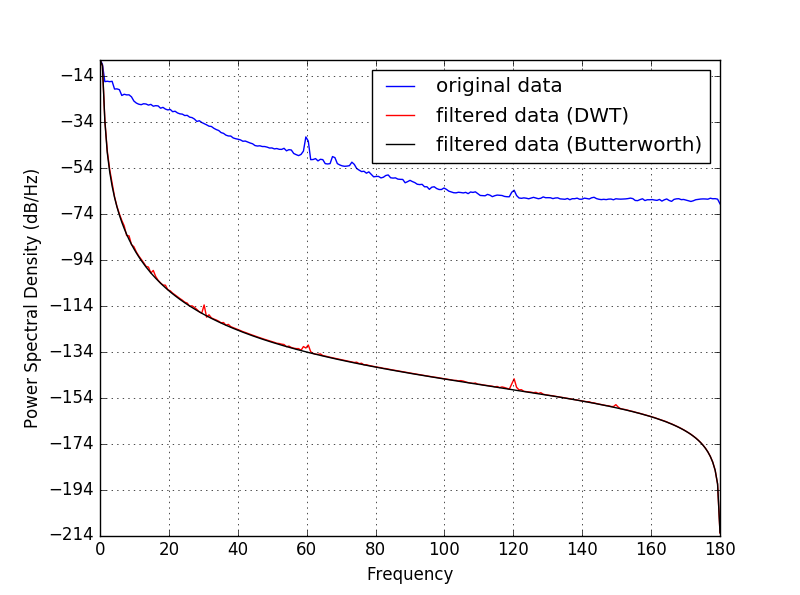
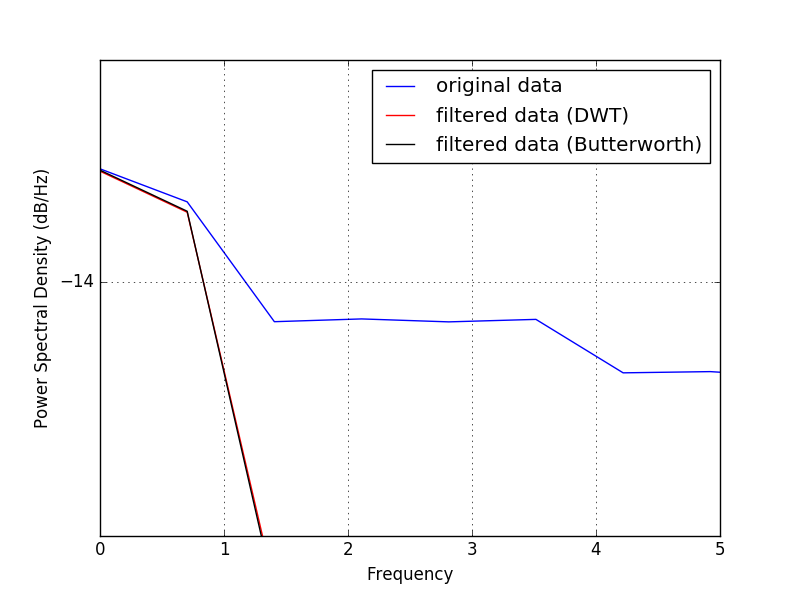
在原始数据中,您可以清楚地看到60 the及其第一个倍数(120 the )。让我们近距离观察一下低频的情况:
现在让我们看一下时域中的数据:
plt.figure(2)
plt.subplot(311)
plt.plot(data,label='original data', color='blue')
plt.title('original')
plt.subplot(312)
plt.plot(filtered_data_dwt, color='red', label='filtered data (DWT)')
plt.title('filtered (DWT)')
plt.subplot(313)
plt.plot(filtered_data_butterworth, color='black', label='filtered data (Butterworth)')
plt.title('filtered (Butterworth)')
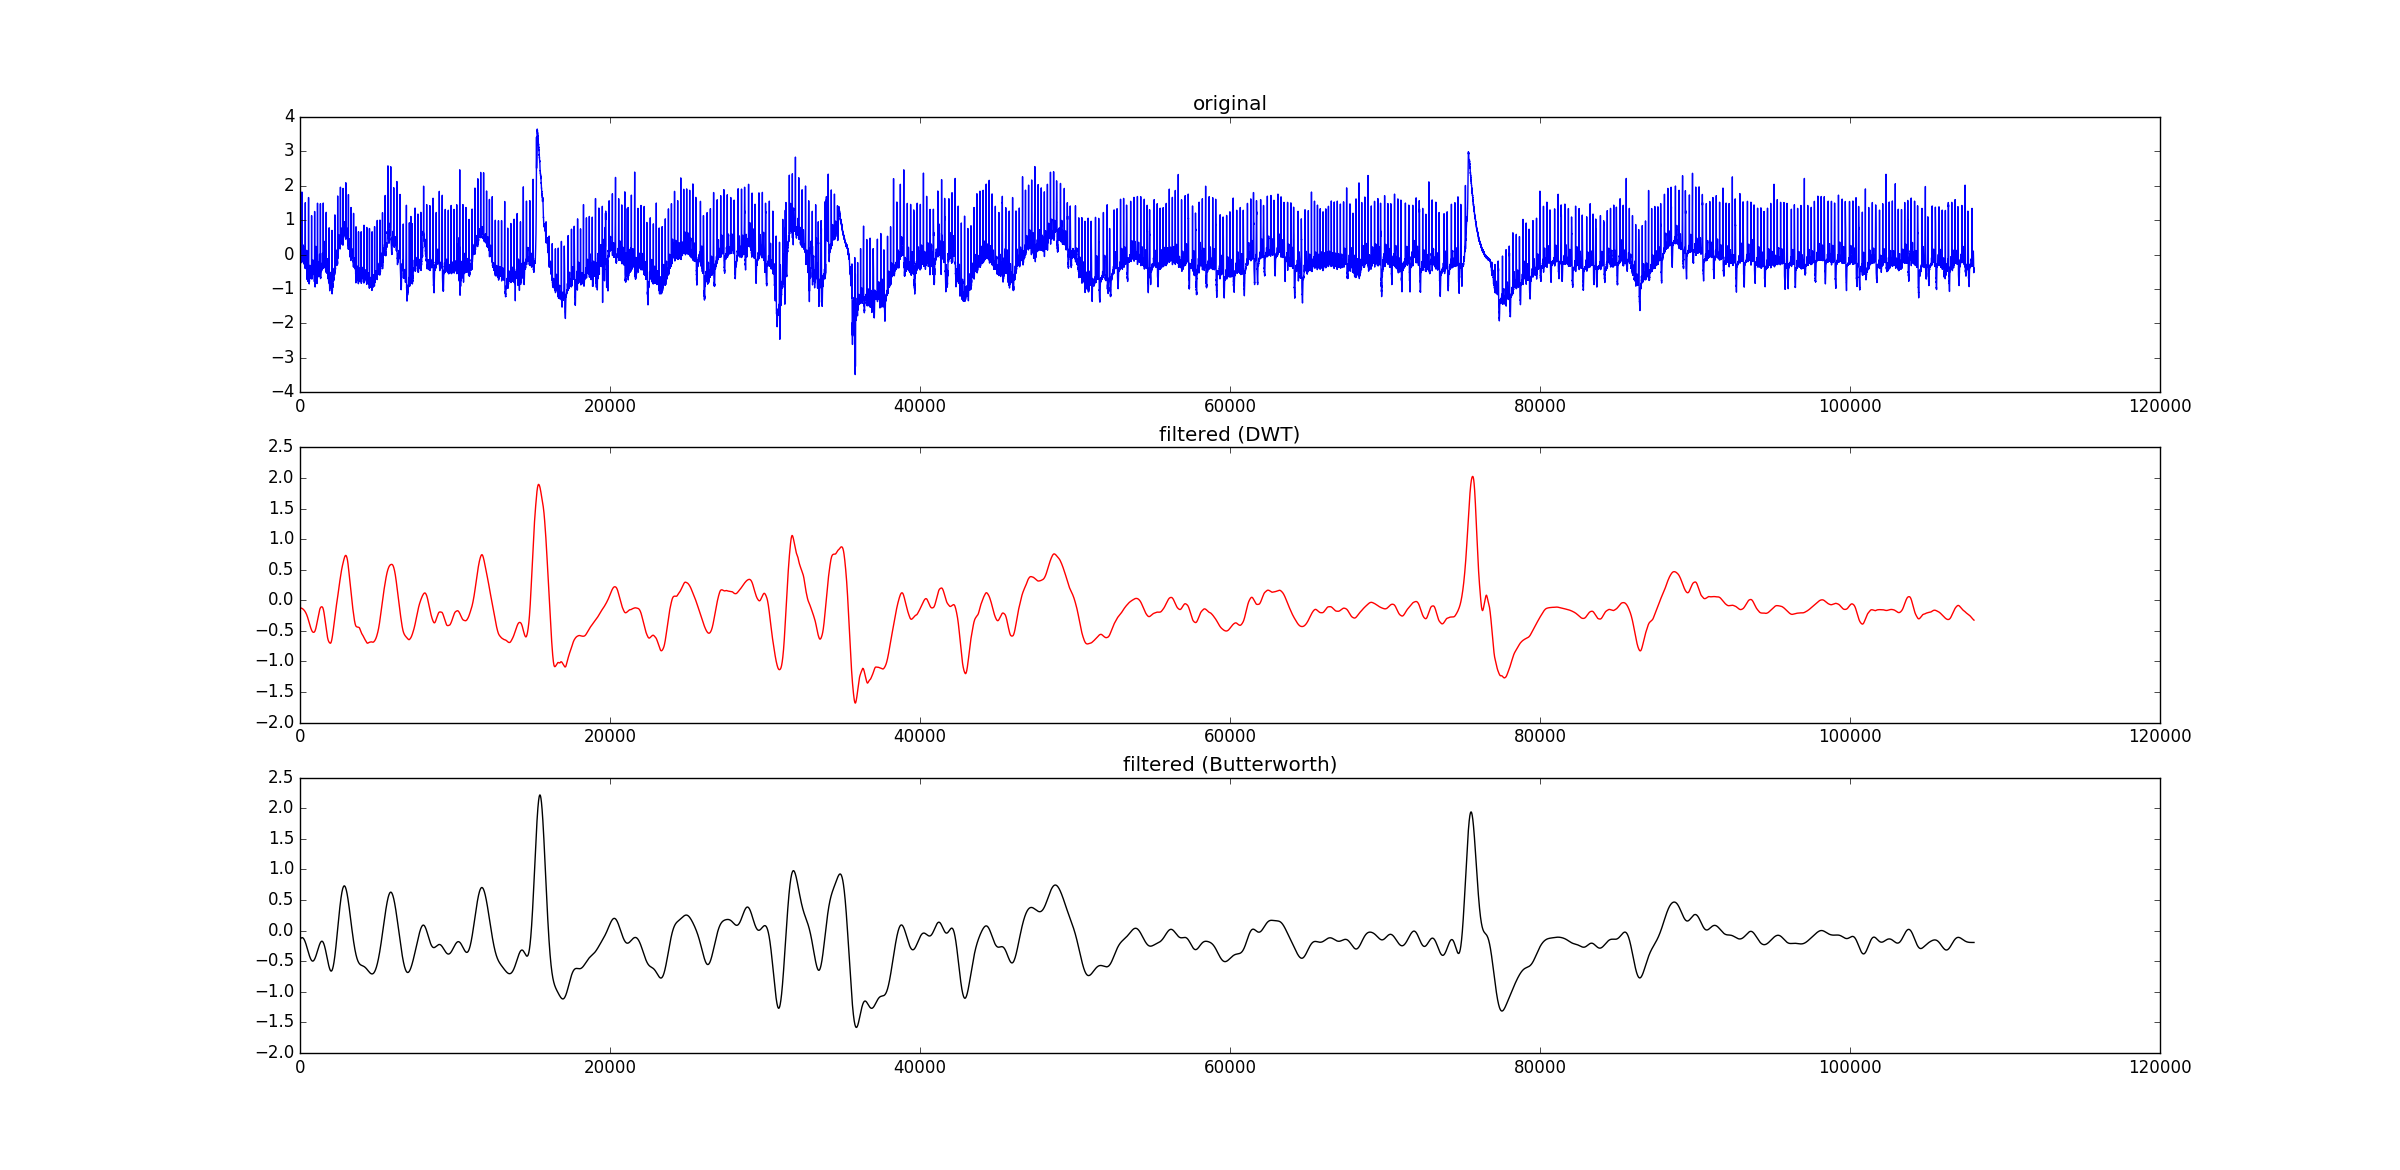
因此,为了使用0.35Hz的截止频率对原始数据进行低通滤波,您可以简单地使用离散小波分解的近似系数(即使用“”小波)来重构它们。希望这会有所帮助!
页面原文内容由Stack Overflow提供。腾讯云小微IT领域专用引擎提供翻译支持
原文链接:
https://stackoverflow.com/questions/54619107
复制相关文章
相似问题
腾讯云开发者

Copyright © 2013 - 2026 Tencent Cloud. All Rights Reserved. 腾讯云 版权所有
深圳市腾讯计算机系统有限公司 ICP备案/许可证号:粤B2-20090059 ![]() 粤公网安备44030502008569号
粤公网安备44030502008569号
腾讯云计算(北京)有限责任公司 京ICP证150476号 | 京ICP备11018762号