
ggdendro图的颜色标签
ggdendro图的颜色标签
提问于 2019-02-10 12:46:42
我试图应用密度,以着色的全球树状标签。我知道这个错误:
Error in UseMethod("as.dendrogram") :
  no applicable method for 'as.dendrogram' applied to an object of class "dendro"
为什么转换不起作用?知道怎么解决吗?
代码:
library(IncDTW)
library(ggplot2)
library(ggdendro)
library(dendextend)
A <- matrix(1:50, nrow = 50, ncol = 1)
B <- matrix(1:75, nrow = 75, ncol = 1)
C <- matrix(25:49, nrow = 25, ncol = 1)
D <- matrix(1:50, nrow = 50, ncol = 1)
treeList <- list(A,B,C,D)
names(treeList)[1] <- "A"
names(treeList)[2] <- "B"
names(treeList)[3] <- "C"
names(treeList)[4] <- "D"
result <- dtw_dismat(treeList, dist_method = "norm2", return_matrix = F)
distMatrixResult <- result$dismat
hc <- hclust(distMatrixResult, method = "average")
hc <- dendro_data(hc)
dict <- setNames(names(treeList), 1:length(names(treeList)))
hc$labels$label <- sapply(hc$labels$label, function(x) dict[[as.character(x)]])
ggdendrogram(hc, rotate = TRUE, theme_dendro = FALSE)
dend <- as.dendrogram(hc)
d5=color_branches(dend)
plot(d5)
d5g=color_branches(dend,5,groupLabels=TRUE)
plot(d5g)
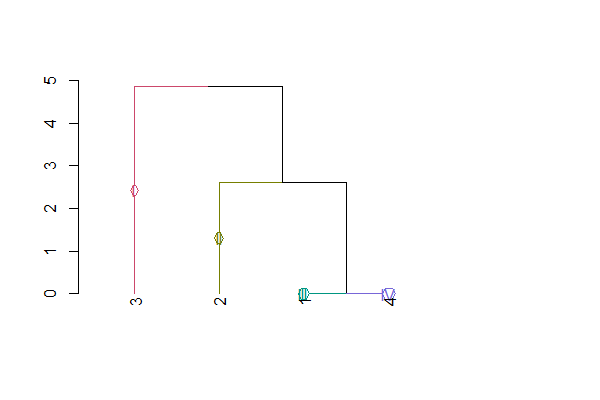
d5gr=color_branches(dend,5,groupLabels=as.roman)
plot(d5gr)回答 2
Stack Overflow用户
回答已采纳
发布于 2019-02-10 14:47:49
好像你把树状图和树状图数据搞混了。这将起作用:
dend <- as.dendrogram(hc)
dict <- setNames(names(treeList), 1:length(names(treeList)))
hc$labels$label <- sapply(hc$labels$label, function(x) dict[[as.character(x)]])
ggdendrogram(dend, rotate = TRUE, theme_dendro = FALSE)
d5=color_branches(dend)
plot(d5)
d5g=color_branches(dend,4,groupLabels=TRUE)
plot(d5g)
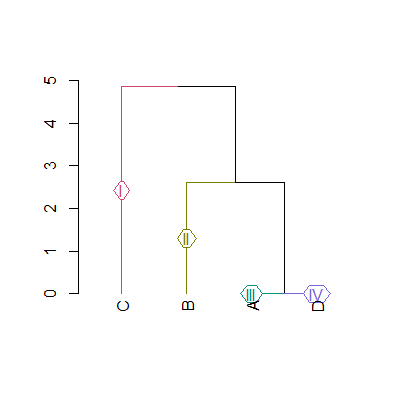
d5gr=color_branches(dend,4,groupLabels=as.roman)
plot(d5gr)结果:
编辑:
作为@maxatSOflow pointed out,我们可以使用usedist::dist_setNames()为"dist"对象设置名称。因此,要像预期的那样最终得到您的树状图,您可以执行以下操作。
library(IncDTW)
result <- dtw_dismat(treeList, dist_method="norm2", return_matrix=FALSE)
distMatrixResult <- result$dismat

# install.packages("usedist")
library(usedist)
distMatrixResult <- dist_setNames(distMatrixResult, LETTERS[1:4])

hc <- hclust(distMatrixResult, method="average")

library(ggdendro)
ggdendrogram(hc, rotate=TRUE, theme_dendro=FALSE)
dend <- as.dendrogram(hc)


library(dendextend)
d5=color_branches(dend)
plot(d5)
d5g=color_branches(dend,4,groupLabels=TRUE)
plot(d5g)
d5gr=color_branches(dend,4,groupLabels=as.roman)
plot(d5gr)
给予:
数据:
A <- matrix(1:50, nrow=50, ncol=1)
B <- matrix(1:75, nrow=75, ncol=1)
C <- matrix(25:49, nrow=25, ncol=1)
D <- matrix(1:50, nrow=50, ncol=1)

treeList <- setNames(list(A, B, C, D), LETTERS[1:4])Stack Overflow用户
发布于 2019-02-11 09:21:47
在当前版本的IncDTW中,您需要在使用dtw_dismat()之后追加名称,在以后的版本中,我将对此进行调整。所以现在试着:
result <- dtw_dismat(treeList, dist_method = "norm2", return_matrix = TRUE)
distMatrixResult <- result$dismat
dnames <- LETTERS[1:4]
dimnames(distMatrixResult) <- list(dnames , dnames)
distMatrixResult <- as.dist(distMatrixResult)还请看这篇文章:ggdendrogram labels
页面原文内容由Stack Overflow提供。腾讯云小微IT领域专用引擎提供翻译支持
原文链接:
https://stackoverflow.com/questions/54616539
复制相关文章
相似问题
腾讯云开发者

Copyright © 2013 - 2026 Tencent Cloud. All Rights Reserved. 腾讯云 版权所有
深圳市腾讯计算机系统有限公司 ICP备案/许可证号:粤B2-20090059 ![]() 粤公网安备44030502008569号
粤公网安备44030502008569号
腾讯云计算(北京)有限责任公司 京ICP证150476号 | 京ICP备11018762号