
修正了在录制Bokeh图中的元素时的HoverTool工具提示
修正了在录制Bokeh图中的元素时的HoverTool工具提示
提问于 2019-02-01 14:23:18
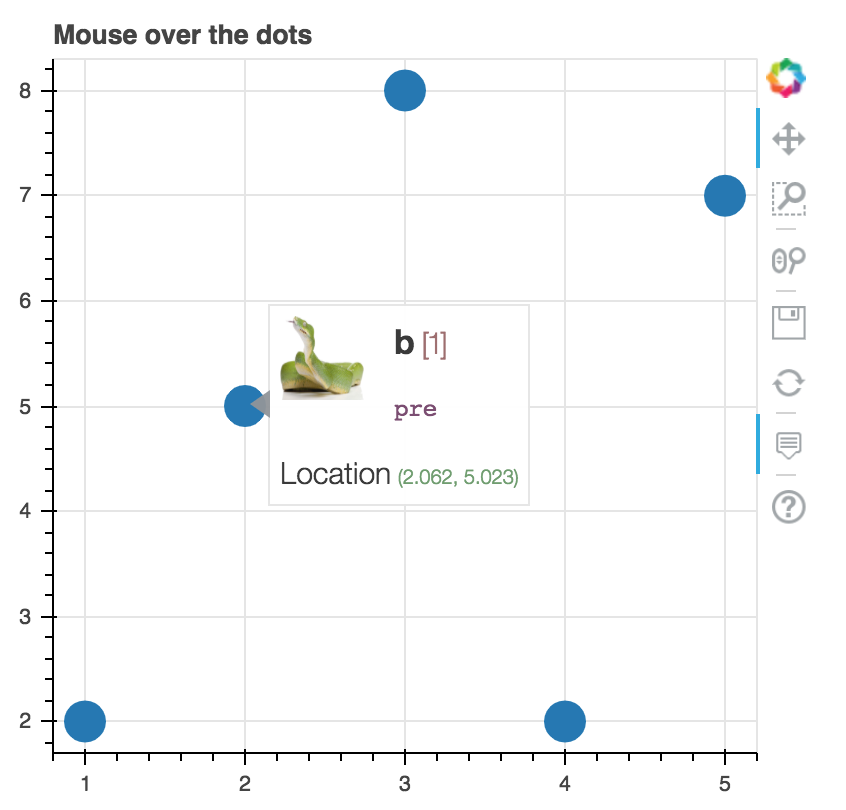
类似于hovertool,我希望当我在绘图元素(在本例中是圆形)上点击时,会弹出一个窗口,其中包含有关元素的信息(见下图)。如果我在单击元素后移动鼠标,窗口将继续显示。有塔普工具的工具提示吗?我非常努力地通过使用CustomJS来做到这一点,但是没有办法显示html内容。有人知道怎么继续吗?
from bokeh.plotting import figure, output_file, show, ColumnDataSource

output_file("toolbar.html")

source = ColumnDataSource(data=dict(
x=[1, 2, 3, 4, 5],
y=[2, 5, 8, 2, 7],
desc=['A', 'b', 'C', 'd', 'E'],
imgs=[
    'https://docs.bokeh.org/static/snake.jpg',
    'https://docs.bokeh.org/static/snake2.png',
    'https://docs.bokeh.org/static/snake3D.png',
    'https://docs.bokeh.org/static/snake4_TheRevenge.png',
    'https://docs.bokeh.org/static/snakebite.jpg'
],
fonts=[
    '<i>italics</i>',
    '<pre>pre</pre>',
    '<b>bold</b>',
    '<small>small</small>',
    '<del>del</del>'
]
))

TOOLTIPS = """
<div>
    <div>
        <img
            src="@imgs" height="42" alt="@imgs" width="42"
            style="float: left; margin: 0px 15px 15px 0px;"
            border="2"
        ></img>
    </div>
    <div>
        <span style="font-size: 17px; font-weight: bold;">@desc</span>
        <span style="font-size: 15px; color: #966;">[$index]</span>
    </div>
    <div>
        <span>@fonts{safe}</span>
    </div>
    <div>
        <span style="font-size: 15px;">Location</span>
        <span style="font-size: 10px; color: #696;">($x, $y)</span>
    </div>
</div>
"""

 p = figure(plot_width=400, plot_height=400, tooltips=TOOLTIPS,
       title="Mouse over the dots")

 p.circle('x', 'y', size=20, source=source)

show(p)从guide/tools.html显示中提取的代码
回答 1
Stack Overflow用户
发布于 2019-03-31 01:11:46
您可以在下面的代码中使用TapTool回调。单击圆圈将显示工具提示。单击绘图的其他地方或单击ResetTool隐藏工具提示。TapTool回调使用与示例中相同的HoverTool工具提示,您可以根据需要进一步定制它。
另请参阅this post,它使用迷你绘图作为工具提示。
此代码用于Bokeh v1.0.4
from bokeh.plotting import figure, output_file, show, ColumnDataSource
from bokeh.models import TapTool, CustomJS, HoverTool, Div, Row

output_file("toolbar.html")

source = ColumnDataSource(data = dict(
x = [1, 2, 3, 3, 4],
y = [2, 5, 8, 3, 6],
desc = ['A', 'B', 'C', 'D', 'E'],
imgs = ['https://docs.bokeh.org/static/snake.jpg',
        'https://docs.bokeh.org/static/snake2.png',
        'https://dods.bokeh.org/static/snake3D.png',
        'https://docs.bokeh.org/static/snake4_TheRevenge.png',
        'https://docs.bokeh.org/static/snakebite.jpg'],
fonts = ['<i>italics</i>',
         '<pre>pre</pre>',
         '<b>bold</b>',
         '<small>small</small>',
         '<del>del</del>' ]))
TOOLTIPS = """
<div>
    <div>
        <img
            src="@imgs" height="42" alt="@imgs" width="42"
            style="float: left; margin: 0px 15px 15px 0px;"
            border="2"/>
    </div>
    <div width=60px>
        <span style="font-size: 17px; font-weight: bold;">@desc</span>
        <span style="font-size: 15px; color: #966;">[$index]</span>
    </div>
    <div>
        <span>@fonts{safe}</span>
    </div>
    <div>
        <span style="font-size: 15px;">Location</span>
        <span style="font-size: 10px; color: #696;">($x, $y)</span>
    </div>
</div> """

p = figure(plot_width = 400, plot_height = 400, x_range = (0, 6), y_range = (1, 9),
      title = "Mouse over the dots", tools = 'pan,wheel_zoom,save,reset,tap')
circles = p.circle('x', 'y', size = 20, source = source)
div = Div(text = '<div id="tooltip" style="position: absolute; display: none"></div>', name = 'tooltip')

code = '''  if (cb_data.source.selected.indices.length > 0){
                var selected_index = cb_data.source.selected.indices[0];
                var tooltip = document.getElementById("tooltip");

                tooltip.style.display = 'block';
                tooltip.style.left = Number(cb_data.geometries.sx) + Number(20) + 'px';
                tooltip.style.top = Number(cb_data.geometries.sy) - Number(20) + 'px';

                tp = tp.replace('@imgs', cb_data.source.data.imgs[selected_index]);
                tp = tp.replace('@desc', cb_data.source.data.desc[selected_index]);
                tp = tp.replace('@fonts{safe}', cb_data.source.data.fonts[selected_index]);
                tp = tp.replace('$index', selected_index);
                tp = tp.replace('$x', Math.round(cb_data.geometries.x));
                tp = tp.replace('$y', Math.round(cb_data.geometries.y));
                tooltip.innerHTML = tp;
          } '''
p.select(TapTool).callback = CustomJS(args = {'circles': circles, 'plot': p, 'tp': TOOLTIPS}, code = code)
source.selected.js_on_change('indices', CustomJS(code = 'if (cb_obj.indices.length == 0) document.getElementById("tooltip").style.display = \"none\"'))
layout = Row(p, div)
show(layout)
结果:
页面原文内容由Stack Overflow提供。腾讯云小微IT领域专用引擎提供翻译支持
原文链接:
https://stackoverflow.com/questions/54481438
复制相关文章
相似问题
腾讯云开发者

Copyright © 2013 - 2026 Tencent Cloud. All Rights Reserved. 腾讯云 版权所有
深圳市腾讯计算机系统有限公司 ICP备案/许可证号:粤B2-20090059 ![]() 粤公网安备44030502008569号
粤公网安备44030502008569号
腾讯云计算(北京)有限责任公司 京ICP证150476号 | 京ICP备11018762号