
如何将我的Kibana吊舱连接到Kubernetes的弹性星系团
我正试着在库伯奈特斯集群中部署弹性和基巴纳。
我使用Helm图表安装了弹性:
helm repo add elastic https://helm.elastic.co
helm repo update
helm install stable/elasticsearch --namespace elastic --name elasticsearch --set imageTag=6.5.4
和使用Helm图表的Kibana:
helm install elastic/kibana --namespace elastic --name kibana --set imageTag=6.5.4,elasticsearchURL=http://elasticsearch-client.elastic.svc.cluster.local:9200我已经检查了我的Kibana吊舱,这个URL是可访问的,并产生以下结果
curl -v http://elasticsearch-client:9200
* About to connect() to elasticsearch-client port 9200 (#0)
*   Trying 10.19.251.82...
* Connected to elasticsearch-client (10.19.251.82) port 9200 (#0)
> GET / HTTP/1.1
> User-Agent: curl/7.29.0
> Host: elasticsearch-client:9200
> Accept: */*
>
< HTTP/1.1 200 OK
< content-type: application/json; charset=UTF-8
< content-length: 519
<
{
  "name" : "elasticsearch-client-8666954ffb-kthcx",
  "cluster_name" : "elasticsearch",
  "cluster_uuid" : "-MT_zbKySiad0jDJVc1ViQ",
  "version" : {
    "number" : "6.5.4",
    "build_flavor" : "oss",
    "build_type" : "tar",
    "build_hash" : "d2ef93d",
    "build_date" : "2018-12-17T21:17:40.758843Z",
    "build_snapshot" : false,
    "lucene_version" : "7.5.0",
    "minimum_wire_compatibility_version" : "5.6.0",
    "minimum_index_compatibility_version" : "5.0.0"
  },
  "tagline" : "You Know, for Search"
}
在Kibana吊舱中启动的命令行(由舵机图表生成)是
/usr/share/kibana/bin/../node/bin/node --no-warnings /usr/share/kibana/bin/../src/cli --cpu.cgroup.path.override=/ --cpuacct.cgroup.path.override=/ --elasticsearch.url=http://elasticsearch-client:9200所以看起来弹性星系团url是正确的,并且是可以到达的。
但是,当我在浏览器中显示UI时,我会得到以下页面
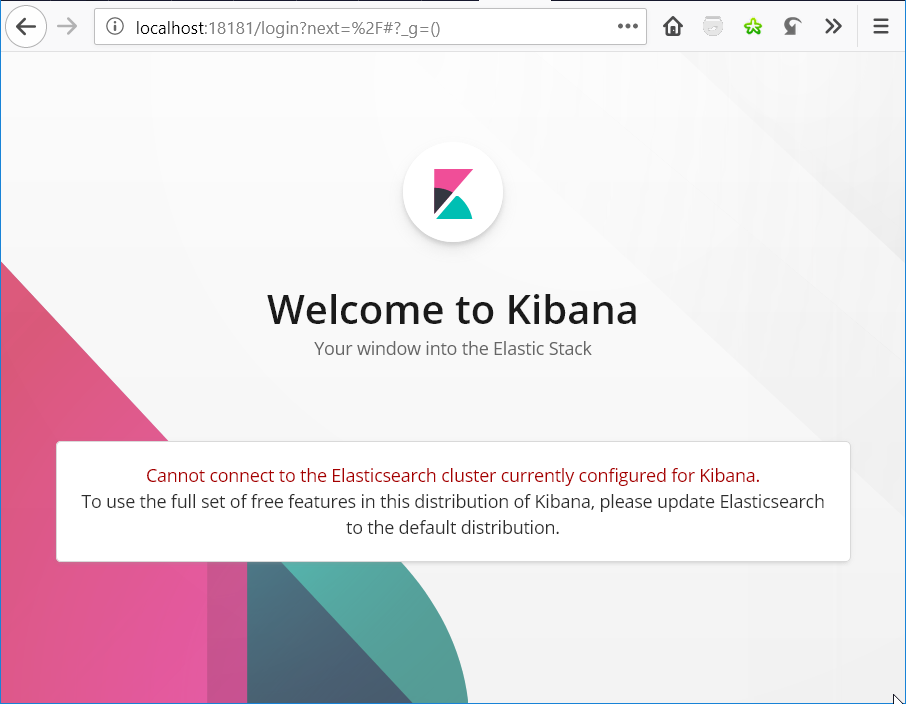
总之,这两个版本是相同的:
- docker.elastic.co/elasticsearch/elasticsearch-oss:6.5.4
- Co.kibana/kibana:6.5.4
ElasticSearch url是正确的,但是Kibana不想访问ElasticSearch
回答 2
Stack Overflow用户
发布于 2019-01-19 20:33:41
我认为你在使用开放源码软件的弹性搜索发行版和非开放源码软件Kibana包。
你能试一试坞.弹性. Can /kibana/kibana:6.5.4吗?
Stack Overflow用户
发布于 2019-01-19 01:36:43
我自己也试过了,关于如何将参数传递到Kibana,Kibana对接者图像和/或Helm图表都有一些内容。基本上,命令行显示:
--elasticsearch.url=http://elasticsearch-client.elastic.svc.cluster.local:9200但是,如果将shell放入容器/荚中,则可以看到Kibana命令行对elasticsearch (-e, --elasticsearch <uri>)的期望有所不同:
$ /usr/share/kibana/bin/kibana --help

  Usage: bin/kibana [command=serve] [options]

  Kibana is an open source (Apache Licensed), browser based analytics and search dashboard for Elasticsearch.

  Commands:
    serve  [options]  Run the kibana server
    help  <command>   Get the help for a specific command

  "serve" Options:

    -h, --help                 output usage information
    -e, --elasticsearch <uri>  Elasticsearch instance
    -c, --config <path>        Path to the config file, can be changed with the CONFIG_PATH environment variable as well. Use multiple --config args to include multiple config files.
    -p, --port <port>          The port to bind to
    -q, --quiet                Prevent all logging except errors
    -Q, --silent               Prevent all logging
    --verbose                  Turns on verbose logging
    -H, --host <host>          The host to bind to
    -l, --log-file <path>      The file to log to
    --plugin-dir <path>        A path to scan for plugins, this can be specified multiple times to specify multiple directories
    --plugin-path <path>       A path to a plugin which should be included by the server, this can be specified multiple times to specify multiple paths
    --plugins <path>           an alias for --plugin-dir
    --optimize                 Optimize and then stop the server
因此,有些地方没有正确地翻译elasticsearch URL。
它似乎默认为localhost:9200,因此您可以在您的kibana部署中尝试一个sidecar容器,以便将端口localhost:9200上的所有内容转发给elasticsearch-client.elastic.svc.cluster.local:9200。也许跟随this
https://stackoverflow.com/questions/54260959
复制相似问题
腾讯云开发者

Copyright © 2013 - 2026 Tencent Cloud. All Rights Reserved. 腾讯云 版权所有
深圳市腾讯计算机系统有限公司 ICP备案/许可证号:粤B2-20090059 ![]() 粤公网安备44030502008569号
粤公网安备44030502008569号
腾讯云计算(北京)有限责任公司 京ICP证150476号 | 京ICP备11018762号