
是否有任何方法将多行图表工具提示格式化为单行?
是否有任何方法将多行图表工具提示格式化为单行?
提问于 2019-01-17 01:54:21
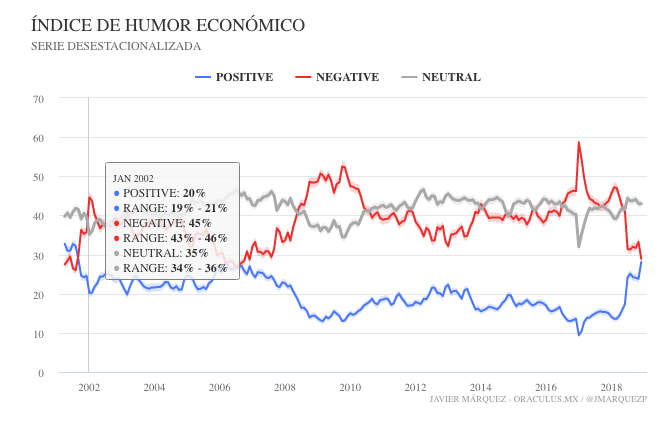
我有一个多系列图表(线和面积范围类型).海图图像
我想格式化工具提示,而不是让:
POSITIVE: 20%
POSITIVE RANGE: 19% - 21%
NEGATIVE: 45%
NEGATIVE RANGE: 43% - 46%
NEUTRAL: 35%
NEUTRAL RANGE: 34% - 36%
将其格式化为:
POSITIVE: 20% (19% - 21%)
NEGATIVE: 45% (43% - 46%)
NEUTRAL: 35% (34% - 36%)
我需要它是一个共享的工具提示,因为图表中有很多数据。
我尝试给每个系列提供id和relatedid,但未能实现格式的改变。
回答 2
Stack Overflow用户
回答已采纳
发布于 2019-01-17 15:40:08
您可以将formatter函数用于工具提示:
tooltip: {
    shared: true,
    formatter: function(e) {
        var points = this.points,
            i,
            result = '';

        function formatPoint(p, low, high) {
            return '<span style="color:' + p.point.color + '">\u25CF</span> ' + p.series.name + ': <b>' + p.point.y + '% (' + low + '% -' + high + ' %)</b><br/>'
        }

        for (i = 0; i < points.length; i += 2) {
            result += formatPoint(points[i], points[i + 1].point.low, points[i + 1].point.high)
        }

        return result
    }
}现场演示:http://jsfiddle.net/BlackLabel/g3qeobaf/
API参考:https://api.highcharts.com/highcharts/tooltip.formatter
Stack Overflow用户
发布于 2019-01-24 16:40:38
在xaxis上,我有日期,我想将它添加到工具提示的顶部,我尝试:
            return   Highcharts.dateFormat('%b - %Y',
                                      new Date(p.x)) +' <span style="color:' + p.point.color + '">\u25CF</span> ' + p.series.name + ': <b>' + Math.round(p.point.y) + '% (' + Math.round(low) + '-' + Math.round(high) + ')</b><br/>'
        }
但是它把它添加到每一行,而不是仅仅在顶部
页面原文内容由Stack Overflow提供。腾讯云小微IT领域专用引擎提供翻译支持
原文链接:
https://stackoverflow.com/questions/54227926
复制相关文章
相似问题
腾讯云开发者

Copyright © 2013 - 2026 Tencent Cloud. All Rights Reserved. 腾讯云 版权所有
深圳市腾讯计算机系统有限公司 ICP备案/许可证号:粤B2-20090059 ![]() 粤公网安备44030502008569号
粤公网安备44030502008569号
腾讯云计算(北京)有限责任公司 京ICP证150476号 | 京ICP备11018762号