
如何使用角7在chart.js中缩放图表
如何使用角7在chart.js中缩放图表
提问于 2019-01-14 07:33:29
我有一个line-chart,我想放大它,但做不到。这是我的密码
let ctx = document.getElementById('myChart')

let chart = new Chart(ctx, {
      type: 'line',
      data: {
        labels: ["Red", "Blue", "Yellow", "Green", "Purple", "Orange"],
        datasets: [{
          label: '# of Votes',
          data: [7, 10, 3, 5, 2, 3],
          fill: true,
          backgroundColor: 'orange',
          borderColor: 'green',
          pointBorderColor: 'red',
          pointBackgroundColor: 'red'
        }]
      },
      options: {
        plugins: {
          pan: {
            enabled: true,
            mode: 'x',
            onPan: function () { console.log('I was panned!!!'); }
          },
          zoom: {
            enabled: true,
            drag: true,
            mode: 'x',
            onZoom: function () { console.log('I was zoomed!!!'); }
          },
        },
        responsive: true,
      }
})<script src="https://cdnjs.cloudflare.com/ajax/libs/Chart.js/2.7.3/Chart.min.js"></script>
<div class="row">
<div class="col d-flex justify-content-center">
<canvas id="myChart" style="max-width:95%;height:300px !important;"></canvas>
</div>
</div>
我在zooming中使用了以下zooming
https://github.com/chartjs/chartjs-plugin-zoom#readme
我还在我的项目中包括了hammerjs和angular/animations。
更新
为什么pan和zoom不为打字稿所知?
// package.json
"chart.js": "^2.7.3",
"chartjs-plugin-zoom": "^0.6.6",
回答 4
Stack Overflow用户
回答已采纳
发布于 2019-04-01 21:57:10
首先,您需要运行npm install chartjs-plugin-zoom来安装npm,然后在您的.ts文件中执行import chartjs-plugin-zoom并编写如下插件:
    plugins: {
      zoom: {
        pan: {
          enabled: true,
          mode: 'x'
        },
        zoom: {
          enabled: true,
          mode: 'x'
        }
      }
}, Stack Overflow用户
发布于 2019-01-14 08:13:12
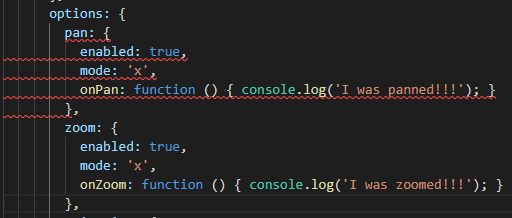
缩放选项应该在options而不是options.plugins设置下配置。
  options: {
    pan: {
      enabled: true,
      mode: 'x',
    },
    zoom: {
      enabled: true,
      mode: 'x',
    },
    responsive: true
  }
看这把小提琴-> http://jsfiddle.net/3sx8zon2/2/
Stack Overflow用户
发布于 2019-06-06 08:32:28
安装chart.js和chartjs-插件-缩放
npm i chart.js -s
npm i chartjs-plugin-zoom -s
在Component.ts文件中导入图表和图表-插件-缩放
import { Chart } from 'chart.js';
import 'chartjs-plugin-zoom';
逻辑加载图
let myChart = new Chart('mapId', {
type: 'bar',
data: {
    labels: ['Red', 'Blue', 'Yellow', 'Green', 'Purple', 'Orange'],
    datasets: [{
        label: '# of Votes',
        data: [12, 19, 3, 5, 2, 3],
        backgroundColor: [
            'rgba(255, 99, 132, 0.2)',
            'rgba(54, 162, 235, 0.2)',
            'rgba(255, 206, 86, 0.2)',
            'rgba(75, 192, 192, 0.2)',
            'rgba(153, 102, 255, 0.2)',
            'rgba(255, 159, 64, 0.2)'
        ],
        borderColor: [
            'rgba(255, 99, 132, 1)',
            'rgba(54, 162, 235, 1)',
            'rgba(255, 206, 86, 1)',
            'rgba(75, 192, 192, 1)',
            'rgba(153, 102, 255, 1)',
            'rgba(255, 159, 64, 1)'
        ],
        borderWidth: 1
    }]
},
options: {
    scales: {
        yAxes: [{
            ticks: {
                beginAtZero: true
            }
        }]
    }
},
    plugins: {
      zoom: {
        pan: {
          enabled: true,
          mode: 'xy'
        },
        zoom: {
          enabled: true,
          mode: 'xy'
        }
      }
    }
  }
});
myChart.render();
在Component.html中
<canvas id="mapId"></canvas>页面原文内容由Stack Overflow提供。腾讯云小微IT领域专用引擎提供翻译支持
原文链接:
https://stackoverflow.com/questions/54177302
复制相关文章
相似问题
腾讯云开发者

Copyright © 2013 - 2026 Tencent Cloud. All Rights Reserved. 腾讯云 版权所有
深圳市腾讯计算机系统有限公司 ICP备案/许可证号:粤B2-20090059 ![]() 粤公网安备44030502008569号
粤公网安备44030502008569号
腾讯云计算(北京)有限责任公司 京ICP证150476号 | 京ICP备11018762号