
如何预测科学知识中未知功能的组成部分-学习?
我有一些图表。所有这些图都是两个参数(Alpha和Beta)的函数。然而,这一职能尚不清楚。我唯一知道的是,通过改变Alpha和Beta,函数的形状会发生变化,但还不清楚这两个参数是如何影响这个函数的形状的。
我想使用机器学习工具(最好是scikit- learning )通过提供任意图形来预测组件、Alpha、和Beta。我将提供更多细节:假设我有3个基于3个文本文件中存储的点的图表:
#First graph: 1.txt
89.3131996411674 0.0
86.31206459803472 1.9218574062324632
81.87220673358236 4.212444252488191
76.41926314984194 7.090515235715248
69.70749592038558 10.46295619504502
4.695619238294171 42.982945242832166
#Second graph: 2.txt
89.31085880364263 0.0
86.14246621045181 0.11975843148903698
81.48739328101496 0.7686454222842645
75.88152851199536 1.501591710302762
69.15242620019211 4.034900351905526
4.674145681785713 41.09359256010945
#Third graph: 3.txt
89.30979468139782 0.0
86.05550911873416 -0.9850540767366983
81.20598538751082 -1.1003291465972356
75.39779664162057 -2.714132118366186
68.62777149709575 -1.3767373919651047
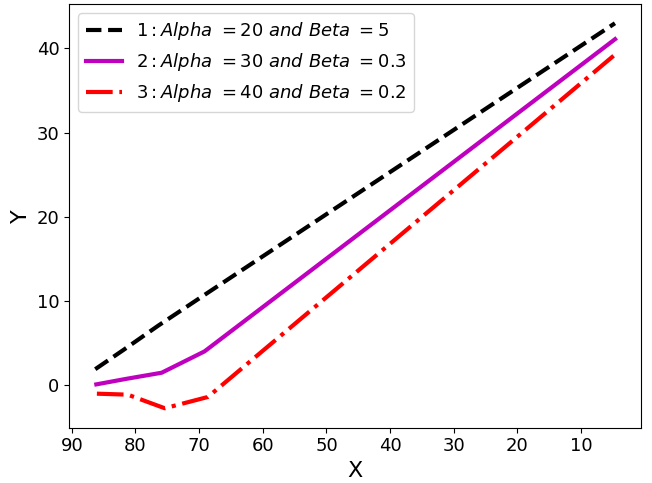
4.653517556961358 39.28302423686896 现在,如果我用以下代码绘制它们:
import matplotlib.pyplot as plt
plt.plotfile('1.txt', delimiter=' ', cols=(0, 1),linestyle='--',linewidth=3,color='k',label=r'$1:Alpha\/\/=20\/\/and\/\/Beta\/\/=5$')
plt.plotfile('2.txt',  delimiter=' ', cols=(0, 1),linestyle='-',linewidth=3,color='m',label=r'$2:Alpha\/\/=30\/\/and\/\/Beta\/\/=0.3$',newfig=False)
plt.plotfile('3.txt', delimiter=' ', cols=(0, 1),linestyle='-.', linewidth=3,color='r',label=r'$3:Alpha\/\/=40\/\/and\/\/Beta\/\/=0.2$',newfig=False)
lg=plt.legend(ncol=1, loc=2, fontsize=13)
plt.xlabel(r'$\mathrm{X}$', fontsize=16)
plt.ylabel(r'$\mathrm{Y}$', fontsize=16)
axes = plt.gca()
plt.gca().invert_xaxis()
plt.tick_params(axis='both', which='major', labelsize=13)
plt.show()
其结果将是:
现在我想给出一个任意的图(点),我期望机器学习算法可以预测系数Alpha和Beta。我需要指出的是,为了简单起见,我在这里只提供了3个图,而在现实中,我有1000多个图和,所有的图都介于图1和图3之间。例如,如果我给出与图3完全相同的点给代码,并要求预测Alpha和Beta,我希望得到:
Alpha = 40
Beta = 0.2
或者,如果我给出与图1完全相同的点给代码,并要求预测Alpha和Beta,我希望得到:
Alpha = 20
Beta = 5我不知道机器学习是否能为我做到这一点,因为我不知道、Alpha、和Beta到底如何影响图形的形状。我只知道图依赖于这两个组件,但我不知道这个函数是什么
我希望如果我为算法提供合理数量的图(作为输入)作为训练集,代码可以预测(估计)任意给定点(图)的Alpha和Beta。
提前感谢您的时间和帮助!
回答 1
Stack Overflow用户
发布于 2019-01-13 13:33:46
从你的问题解释来看,对于1000个图中的每个图是否都有alpha和beta值还不清楚,我假设你没有,你只有值。如果是这样的话,我假设是alpha = 0.4,而上面的beta = 0.2只是一些虚拟的值。
如果你假设你的图是直线,你可以用线性回归来为给定的图建立参数a和b的估计,它们对应于拦截器(a在方程下面)和系数(b在方程下面)。通过这样做,您将了解a和b如何影响给定图的函数形状。换句话说,您将了解什么是功能。
import pandas as pd
import numpy as np
from sklearn.linear_model import LinearRegression

df = pd.read_csv("1.txt", delimiter="\t")
x = df.x.values.reshape(-1, 1)
y = df.y.values.reshape(-1, 1)
model = LinearRegression(fit_intercept=True)
model.fit(x, y)
# This corresponds to a and b from equation above
print(model.coef_, model.intercept_)
但是,如果图形不是直线,则可以使用多项式回归。假设你认为你的函数是2次多项式,那么你就会有以下方程:
import pandas as pd
import numpy as np
from sklearn.linear_model import LinearRegression
from sklearn.preprocessing import PolynomialFeatures

df = pd.read_csv("1.txt", delimiter="\t")
x = df.x.values.reshape(-1, 1)
y = df.y.values.reshape(-1, 1)
poly = PolynomialFeatures(degree=2)
X_ = poly.fit_transform(x) # Transforming into degree two polynomial
model = LinearRegression(fit_intercept=True)
model.fit(X_, y)
# This corresponds to a,b and c from equation above
print(model.coef_, model.intercept_)
你可以使用更高的多项式,如果你愿意,它们将适合更复杂的函数。
通过这样做,您将学习参数来了解给定的x,输出y是什么,这不是您所描述的问题。你想知道α和β是什么。
如果你紧跟我写的东西,你可能会发现α和β是一些参数(如a,b,c等),但是为了计算它们的近似值,你必须知道使用了哪一种多项式函数,然后找出哪一个参数(a,b,c,等等)。阿尔法和贝塔是。
https://stackoverflow.com/questions/54163935
复制相似问题
腾讯云开发者

Copyright © 2013 - 2026 Tencent Cloud. All Rights Reserved. 腾讯云 版权所有
深圳市腾讯计算机系统有限公司 ICP备案/许可证号:粤B2-20090059 ![]() 粤公网安备44030502008569号
粤公网安备44030502008569号
腾讯云计算(北京)有限责任公司 京ICP证150476号 | 京ICP备11018762号