
使用matplotlib的python 3.7中的黑噪声
使用matplotlib的python 3.7中的黑噪声
提问于 2019-01-10 18:20:22
我在python 3.7中运行了这段代码:
import matplotlib.pylab as plt
LETTERS = 'ABCDEFGHIJKLMNOPQRSTUVWXYZ'
def frequency_analysis(plain_text):
#the text we analyise
plain_text = plain_text.upper()
#we use a dictionary to store the letter-frequency pair
letter_frequency = {}
#initialize the dictionary (of course with 0 frequencies)
for letter in LETTERS:
letter_frequency[letter] = 0
#let's consider the text we want to analyse
for letter in plain_text:
#we keep incrementing the occurence of the given letter
if letter in LETTERS:
letter_frequency[letter] += 1
return letter_frequency
def plot_distribution(letter_frequency):
centers = range(len(LETTERS))
plt.xlabel("Letters")
plt.ylabel("Numbers")
plt.bar(centers, letter_frequency.values(), align='center', tick_label=letter_frequency.keys())
plt.xlim([0,len(LETTERS)-1])
plt.show()
if __name__ == "__main__":
plain_text = "Shannon defined the quantity of information produced by a source for example, the quantity in a message by a formula similar to the equation that defines thermodynamic entropy in physics. In its most basic terms, Shannon's informational entropy is the number of binary digits required to encode a message. Today that sounds like a simple, even obvious way to define how much information is in a message. In 1948, at the very dawn of the information age, this digitizing of information of any sort was a revolutionary step. His paper may have been the first to use the word bit, short for binary digit. As well as defining information, Shannon analyzed the ability to send information through a communications channel. He found that a channel had a certain maximum transmission rate that could not be exceeded. Today we call that the bandwidth of the channel. Shannon demonstrated mathematically that even in a noisy channel with a low bandwidth, essentially perfect, error-free communication could be achieved by keeping the transmission rate within the channel's bandwidth and by using error-correcting schemes: the transmission of additional bits that would enable the data to be extracted from the noise-ridden signal. Today everything from modems to music CDs rely on error-correction to function. A major accomplishment of quantum-information scientists has been the development of techniques to correct errors introduced in quantum information and to determine just how much can be done with a noisy quantum communications channel or with entangled quantum bits (qubits) whose entanglement has been partially degraded by noise."
frequencies = frequency_analysis(plain_text)
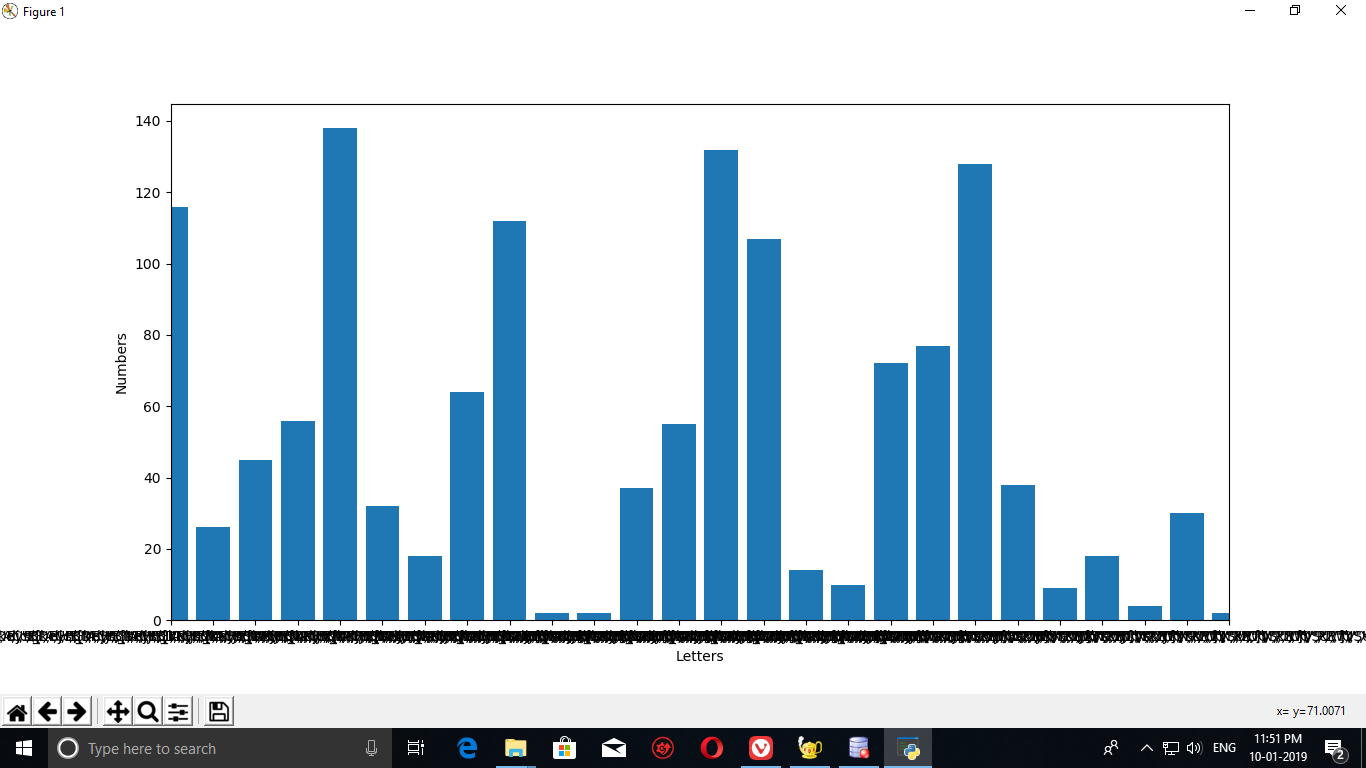
plot_distribution(frequencies)我得到了这个输出:它在x轴上有黑色噪音。
这是在python 2.7上运行相同代码的输出:
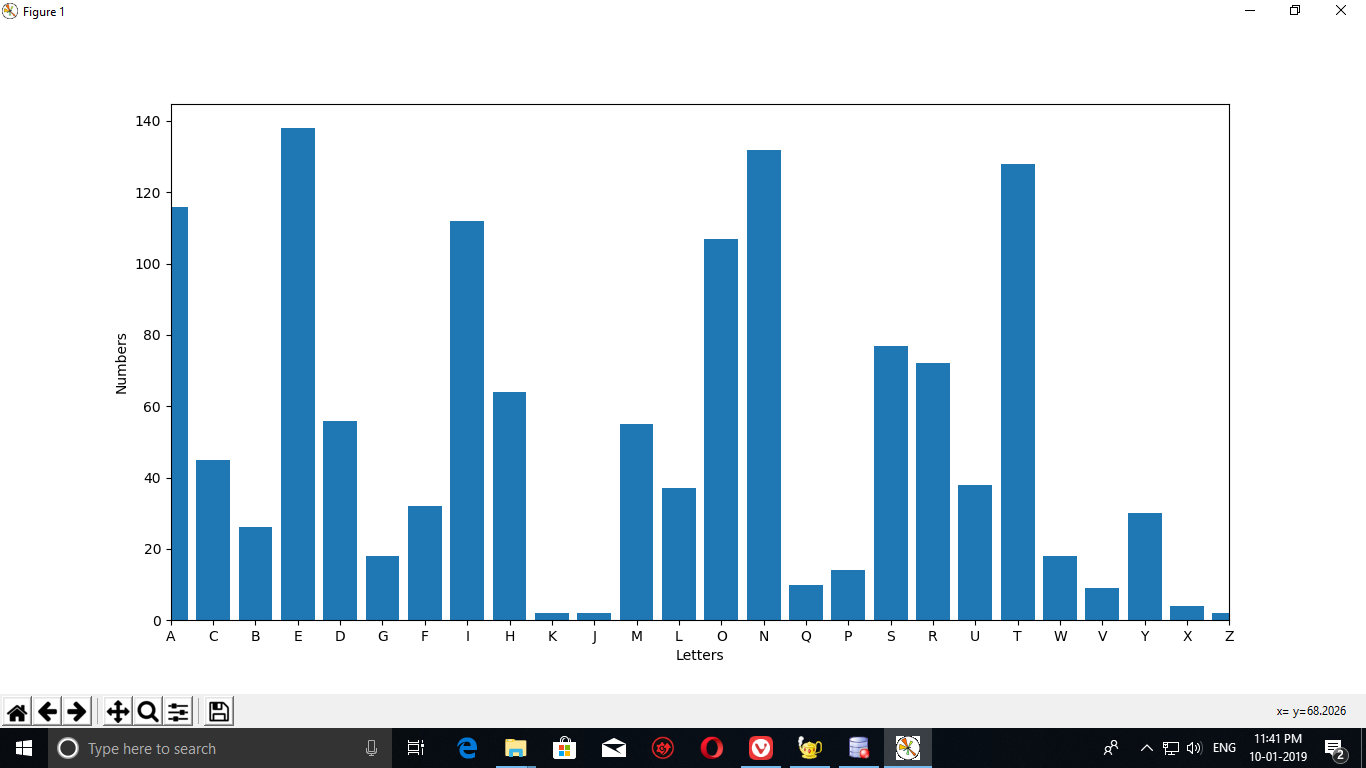
黑噪音在python2.7中没有出现
有什么办法可以消除python 3.7中的黑噪音吗
回答 2
Stack Overflow用户
回答已采纳
发布于 2019-01-10 18:26:10
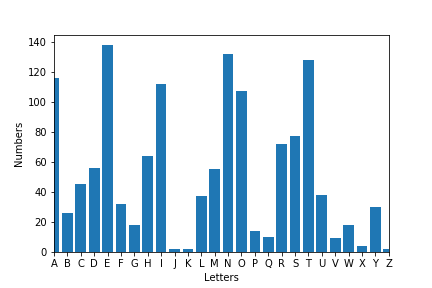
问题在于滴答标签的争论。在python3.6中,它被用作字典,因此标签以奇怪的重叠方式出现。只需将其转换为list即可解决问题。
如果你在print letter_frequency.keys() in python 3.6,你会得到
dict_keys(['A', 'B', 'C', 'D', 'E', 'F', 'G', 'H', 'I', 'J', 'K', 'L', 'M', 'N', 'O', 'P', 'Q', 'R', 'S', 'T', 'U', 'V', 'W', 'X', 'Y', 'Z']) 如果您在python 2.x中这样做,您将得到
['A', 'B', 'C', 'D', 'E', 'F', 'G', 'H', 'I', 'J', 'K', 'L', 'M', 'N', 'O', 'P', 'Q', 'R', 'S', 'T', 'U', 'V', 'W', 'X', 'Y', 'Z']因此,如果使用python 3.6,则将letter_frequency.keys()转换为列表。This文章全面讨论了这个python问题。
码
def plot_distribution(letter_frequency):
    centers = range(len(LETTERS))
    plt.xlabel("Letters")
    plt.ylabel("Numbers")
    plt.bar(centers, letter_frequency.values(), align='center',
            tick_label=list(letter_frequency.keys())) # <--- list conversion
    plt.xlim([0,len(LETTERS)-1])
Stack Overflow用户
发布于 2019-01-10 21:06:55
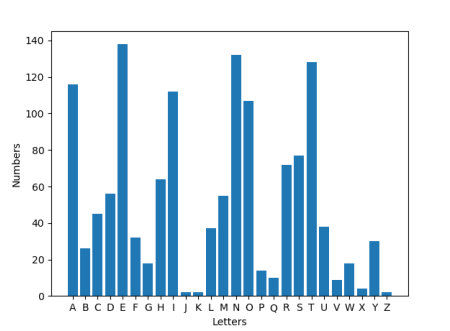
依赖字典的顺序总是有点危险。因此,请允许我提出以下解决方案,该解决方案要短得多,而且不需要排序字典。它可以使用python2.7或3.5或更高版本,但需要matplotlib >= 2.2。
from collections import Counter
import matplotlib.pylab as plt

LETTERS = 'ABCDEFGHIJKLMNOPQRSTUVWXYZ'

def frequency_analysis(plain_text):
    return Counter(plain_text.replace(" ", "").upper())

def plot_distribution(letter_frequency):
    plt.xlabel("Letters")
    plt.ylabel("Numbers")
    plt.bar(list(LETTERS), [letter_frequency[c] for c in LETTERS], align='center')
    plt.show()

if __name__ == "__main__":
    plain_text = "Shannon defined the quantity of information produced by a source for example, the quantity in a message by a formula similar to the equation that defines thermodynamic entropy in physics. In its most basic terms, Shannon's informational entropy is the number of binary digits required to encode a message. Today that sounds like a simple, even obvious way to define how much information is in a message. In 1948, at the very dawn of the information age, this digitizing of information of any sort was a revolutionary step. His paper may have been the first to use the word bit, short for binary digit. As well as defining information, Shannon analyzed the ability to send information through a communications channel. He found that a channel had a certain maximum transmission rate that could not be exceeded. Today we call that the bandwidth of the channel. Shannon demonstrated mathematically that even in a noisy channel with a low bandwidth, essentially perfect, error-free communication could be achieved by keeping the transmission rate within the channel's bandwidth and by using error-correcting schemes: the transmission of additional bits that would enable the data to be extracted from the noise-ridden signal. Today everything from modems to music CDs rely on error-correction to function. A major accomplishment of quantum-information scientists has been the development of techniques to correct errors introduced in quantum information and to determine just how much can be done with a noisy quantum communications channel or with entangled quantum bits (qubits) whose entanglement has been partially degraded by noise."
    frequencies = frequency_analysis(plain_text)
    plot_distribution(frequencies)
页面原文内容由Stack Overflow提供。腾讯云小微IT领域专用引擎提供翻译支持
原文链接:
https://stackoverflow.com/questions/54134747
复制相关文章
相似问题
腾讯云开发者

Copyright © 2013 - 2026 Tencent Cloud. All Rights Reserved. 腾讯云 版权所有
深圳市腾讯计算机系统有限公司 ICP备案/许可证号:粤B2-20090059 ![]() 粤公网安备44030502008569号
粤公网安备44030502008569号
腾讯云计算(北京)有限责任公司 京ICP证150476号 | 京ICP备11018762号