
将图与缺失的x值组合在一起
将图与缺失的x值组合在一起
提问于 2018-12-27 11:48:39
这可能是重复的,但我无法找到解决方案,因此,如下所示:
我正在尝试将以下数据合并到一个图中。Df1:
quarter   count
2017-1    1
2017-2    1
2017-3    1
2017-4    2
2018-2    5
2018-3    2
使用Df2:
quarter   count
2017-1    9
2017-2    16
2017-3    6
2017-4    15
2018-1    14
2018-2    17
2018-3    20
2018-4    16
但是,如果我运行以下命令:
ax = plt.gca()
Df1.plot(x = 'quarter', y = 'count', ax = ax)
Df2.plot(x = 'quarter', y = 'count', ax = ax)
plt.xticks(Df2.index, Df2['quarter'].values)
事情出了问题,因为它只是把Df1的'2018-2‘和'2018-3’标出'2018-1‘和'2018-2’点。我想这会发生,因为Df1没有'2018-1‘值。知道怎么解决这个问题吗?(让Df1 2018-1的地块为0?)
回答 1
Stack Overflow用户
回答已采纳
发布于 2018-12-27 12:32:08
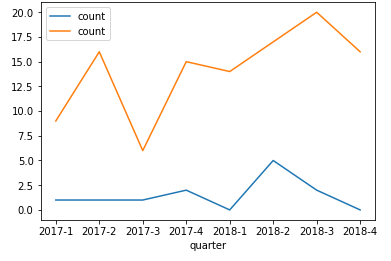
df1 = df1.set_index('quarter').reindex_like(df2.set_index('quarter')).reset_index().fillna(0)

ax = plt.gca()
df1.plot(x = 'quarter', y = 'count', ax = ax)
df2.plot(x = 'quarter', y = 'count', ax = ax)
plt.xticks(df2.index, df2['quarter'].values)
plt.show()
输出图如下所示:
页面原文内容由Stack Overflow提供。腾讯云小微IT领域专用引擎提供翻译支持
原文链接:
https://stackoverflow.com/questions/53944590
复制相关文章
相似问题
腾讯云开发者

Copyright © 2013 - 2026 Tencent Cloud. All Rights Reserved. 腾讯云 版权所有
深圳市腾讯计算机系统有限公司 ICP备案/许可证号:粤B2-20090059 ![]() 粤公网安备44030502008569号
粤公网安备44030502008569号
腾讯云计算(北京)有限责任公司 京ICP证150476号 | 京ICP备11018762号