
Matplotlib -提取三维多边形图的二维轮廓
我有一个由一组Poly3DCollection定义的3D图。集合中的每个多边形都包含一个3D简单元素列表(一个单纯形=4个点),如下所示。
[[[21096.4, 15902.1, 74.3],
  [21098.5, 15904.3, 54.7],
  [21114.2, 15910.1, 63.0],
  [21096.4, 15902.1, 74.3]],
  ...
 [[21096.4, 15902.1, 74.3],
  [21114.8, 15909.9, 91.3],
  [21114.2, 15910.1, 63.0],
  [21096.4, 15902.1, 74.3]]]
在这些集合中,我绘制了一个三维网格,给出了这个结果。
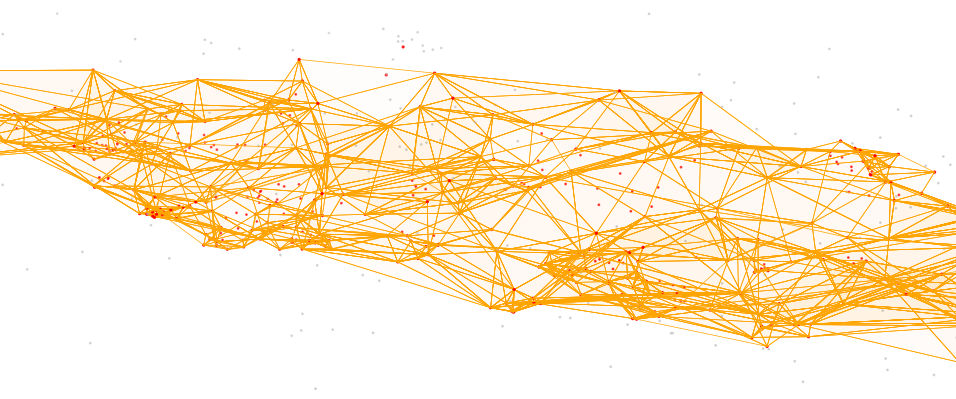
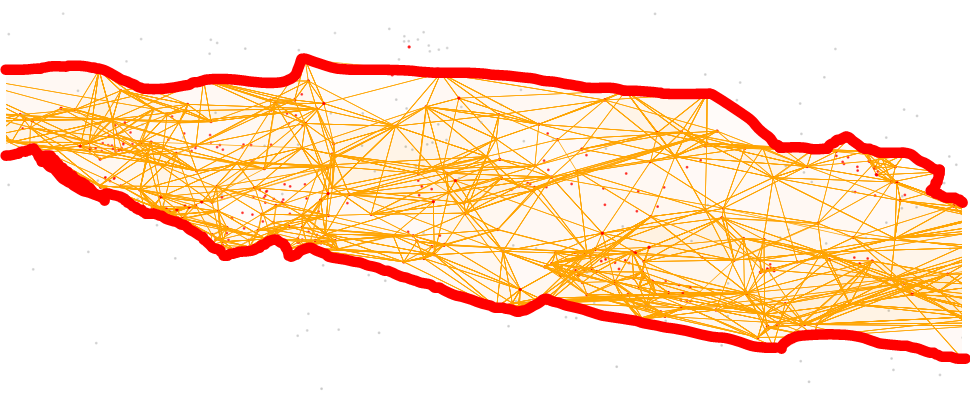
我想确定这个三维网格的轮廓时,投影在2D屏幕上的绘图,以突出它。理想情况下,它会给我一些类似的东西
有什么方法可以做到这一点吗?
为了达到这个目标,我在想
- 获得我的3D点的2D坐标,一旦投影在可视化平面上,将每个点乘以一个投影矩阵,这个投影矩阵是matplotlib最终渲染所必需的,或直接从matplotlib内部获取投影的2D坐标,我不知道这是否可能。
- 一种二维轮廓检测算法在二维坐标检测中的应用
- 将步骤2中找到的2D轮廓添加到现有的3D绘图中。
但是,我没有找到从matplotlib Axes3D对象公开的接口实现此轮廓检测的任何方法。
只要我能完成二维轮廓的绘制,无论是直接在原始的3D数据集和投影上,还是从matplotlib Axes3D对象上确定它,对我来说都无关紧要。
回答 1
Stack Overflow用户
发布于 2018-12-07 21:09:55
事实证明,这比我最初预期的要复杂得多。我解决这个问题的方法是首先把物体旋转成正面视图(根据Axes3D elev和azim角度),把它投影到y-z平面上,计算2D轮廓,重新添加第三维空间,然后将现在的三维轮廓旋转回当前的视图。
旋转部分可以用简单的矩阵运算来完成,只需注意x、y和z轴在旋转前可能被拉伸,并且不需要拉伸。
投影部分有点棘手,因为我不知道有什么聪明的方法可以找到这么多点的外部点。因此,我通过分别计算每个单纯形的投影来解决这个问题,计算它们的二维凸包(使用scipy),将它们转换成shapely多边形,最后计算所有这些多边形的并。然后,我添加了丢失的x坐标,并将整个事物旋转回当前视图。
默认情况下,Axes3D对象使用透视图,导致对象的实际轮廓与计算的投影不完全对齐。可以通过使用正交视图(使用ax.set_proj_type('ortho')设置)来避免这种情况。
最后,一旦图像被旋转,就需要更新大纲/投影。因此,我将整个函数添加到this example之后的事件队列中。
如果还有其他问题,请问。
from mpl_toolkits.mplot3d import Axes3D
from mpl_toolkits.mplot3d.art3d import Poly3DCollection, Line3DCollection
from matplotlib import pyplot as plt
import numpy as np
from shapely.geometry import Polygon
from scipy.spatial import ConvexHull
from scipy.spatial import Delaunay
##the figure
fig, ax = plt.subplots(subplot_kw=dict(projection='3d'))
##generating some random points:
points = np.random.rand(50,3)
xmin,xmax = 0,100
ymin,ymax = -10,10
zmin,zmax = -20,20
points[:,1] = (points[:,1]*(ymax-ymin)+ymin) * np.sin(points[:,0]*np.pi)
points[:,2] = (points[:,2]*(zmax-zmin)+zmin) * np.sin(points[:,0]*np.pi)
points[:,0] *= 100
##group them into simlices
tri = Delaunay(points)
simplex_coords = np.array([tri.points[simplex] for simplex in tri.simplices])
##plotting the points
ax.scatter(points[:,0], points[:,1], points[:,2])
##visualizing simplices
line_coords = np.array(
[[c[i],c[j]] for c in simplex_coords for i in range(len(c)) for j in range(i+1,len(c))]
)
simplex_lines = Line3DCollection(line_coords, colors='k', linewidths=1, zorder=10)
ax.add_collection3d(simplex_lines)
##adjusting plot
ax.set_xlim([xmin,xmax])
ax.set_xlabel('x')
ax.set_ylim([2*ymin,2*ymax])
ax.set_ylabel('y')
ax.set_zlim([2*zmin,2*zmax])
ax.set_zlabel('z')
def compute_2D_outline():
"""
Compute the outline of the 2D projection of the 3D mesh and display it as
a Poly3DCollection or a Line3DCollection.
"""
global collection
global lines
global elev
global azim
##remove the previous projection (if it has been already created)
try:
collection.remove()
lines.remove()
except NameError as e:
pass
##storing current axes orientation
elev = ax.elev
azim = ax.azim
##convert angles
theta = -ax.elev*np.pi/180
phi = -ax.azim*np.pi/180
#the extend of each of the axes:
diff = lambda t: t[1]-t[0]
lx = diff(ax.get_xlim())
ly = diff(ax.get_ylim())
lz = diff(ax.get_zlim())
##to compute the projection, we 'unstretch' the axes and rotate them
##into the (elev=0, azmi=0) orientation
stretch = np.diag([1/lx,1/ly,1/lz])
rot_theta = np.array([
[np.cos(theta), 0, -np.sin(theta)],
[0, 1, 0],
[np.sin(theta), 0, np.cos(theta)],
])
rot_phi = np.array([
[np.cos(phi), -np.sin(phi), 0],
[np.sin(phi), np.cos(phi), 0],
[0,0,1],
])
rot_tot = np.dot(rot_theta,np.dot(rot_phi,stretch))
##after computing the outline, we will have to reverse this operation:
bstretch = np.diag([lx,ly,lz])
brot_theta = np.array([
[ np.cos(theta), 0, np.sin(theta)],
[0, 1, 0],
[-np.sin(theta), 0, np.cos(theta)],
])
brot_phi = np.array([
[ np.cos(phi), np.sin(phi), 0],
[-np.sin(phi), np.cos(phi), 0],
[0,0,1],
])
brot_tot = np.dot(np.dot(bstretch,brot_phi),brot_theta)
##To get the exact outline, we will have to compute the projection of each simplex
##separately and compute the convex hull of the projection. We then use shapely to
##compute the unity of all these convex hulls to get the projection (or shadow).
poly = None
for simplex in simplex_coords:
simplex2D = np.dot(rot_tot,simplex.T)[1:].T
hull = simplex2D[ConvexHull(simplex2D).vertices]
if poly is None:
poly = Polygon(hull)
else:
poly = poly.union(Polygon(hull))
##the 2D points of the final projection have to be made 3D and transformed back
##into the correct axes rotation
outer_points2D = np.array(poly.exterior.coords.xy)
outer_points3D = np.concatenate([[np.zeros(outer_points2D.shape[1])],outer_points2D])
outer_points3D_orig = np.dot(brot_tot, outer_points3D)
##adding the polygons
collection = Poly3DCollection(
[outer_points3D_orig.T], alpha=0.25, facecolor='b', zorder=-1
)
ax.add_collection3d(collection)
##adding the lines
lines = Line3DCollection(
[outer_points3D_orig.T], alpha=0.5, colors='r', linewidths=5, zorder=5
)
ax.add_collection3d(lines)
def on_move(event):
"""
For tracking rotations of the Axes3D object
"""
if event.inaxes == ax and (elev != ax.elev or azim != ax.azim):
compute_2D_outline()
fig.canvas.draw_idle()
##initial outline:
compute_2D_outline()
##the entire thing will only work correctly with an orthogonal view
ax.set_proj_type('ortho')
##saving ax.azim and ax.elev for on_move function
azim = ax.azim
elev = ax.elev
##adding on_move to the event queue
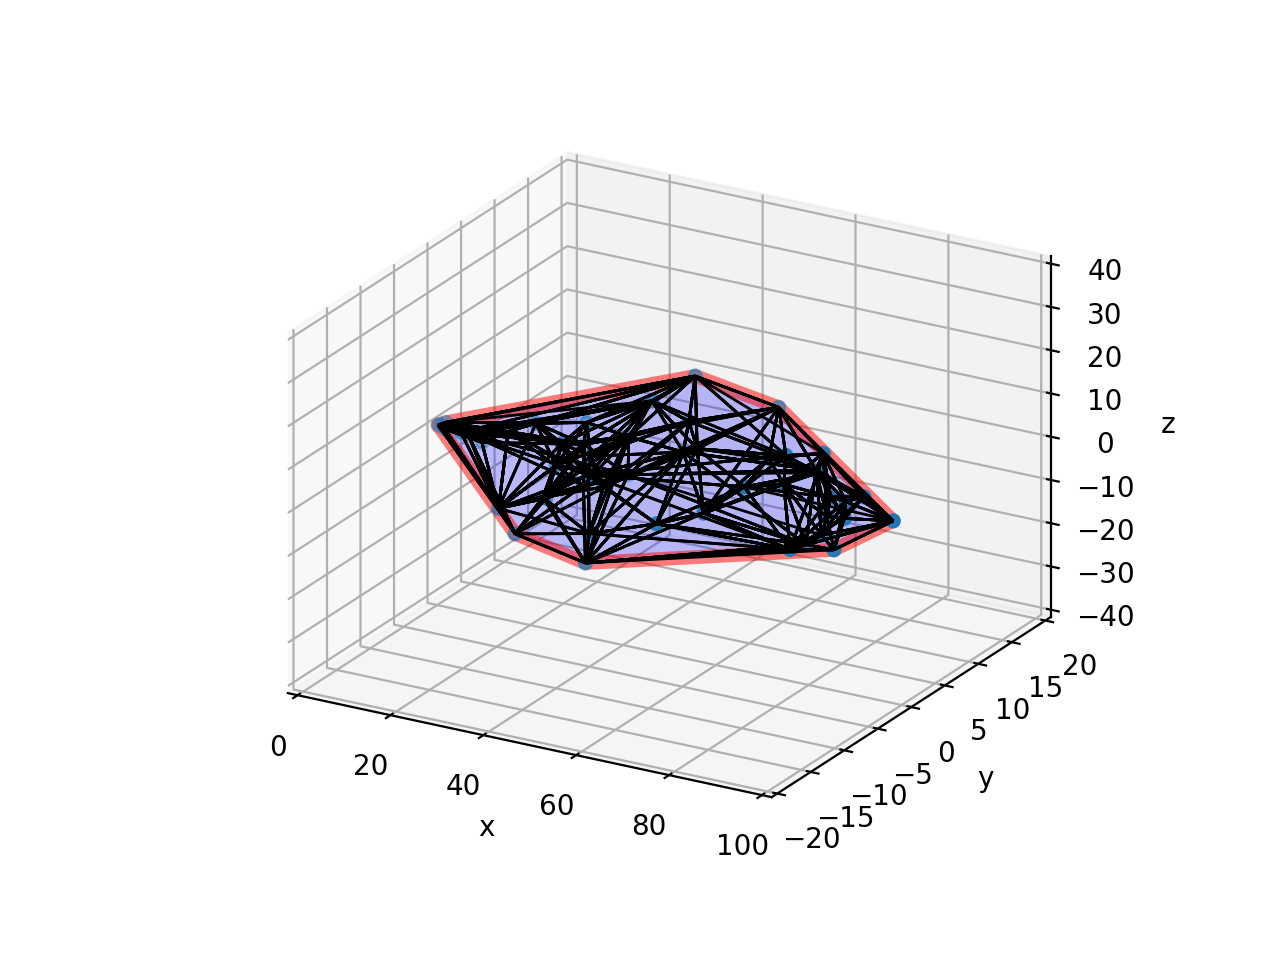
c1 = fig.canvas.mpl_connect('motion_notify_event', on_move)
plt.show()最后的结果(包含一些生成的随机数据)如下所示:
https://stackoverflow.com/questions/53652749
复制相似问题
腾讯云开发者

Copyright © 2013 - 2026 Tencent Cloud. All Rights Reserved. 腾讯云 版权所有
深圳市腾讯计算机系统有限公司 ICP备案/许可证号:粤B2-20090059 ![]() 粤公网安备44030502008569号
粤公网安备44030502008569号
腾讯云计算(北京)有限责任公司 京ICP证150476号 | 京ICP备11018762号