
方块情节媒介没有排队。
方块情节媒介没有排队。
提问于 2018-12-04 19:46:44
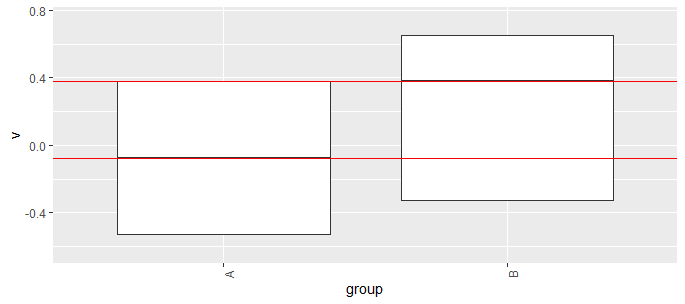
WHen运行此代码--红线应该与方框中的中线匹配。它只适用于一只猩猩,而不是另一只。知道为什么吗?
此外,还产生了一条警告信息。
"Warning message:
Removed 7 rows containing non-finite values (stat_boxplot). "
那是怎么回事?
set.seed(123)
d = data.frame(group=c(rep("A",10),rep("B",10)),v = rnorm(20))
summary_stats = d %>% dplyr::filter( is.na(v) ==FALSE) %>% dplyr::group_by(group) %>%
  dplyr::summarise(
    Q1 = quantile(v,.25,na.rm =TRUE),
    MEDIAN = quantile(v,.5,na.rm =TRUE),
    Q3 = quantile(v,.75,na.rm =TRUE)
) %>% dplyr::mutate(IQR = Q3-Q1) %>% dplyr::arrange(MEDIAN)

boxplot.stats(d[d$group=="A",]$v  )
boxplot.stats(d[d$group=="B",]$v  )

d$group = factor( d$group ,levels=summary_stats$group, ordered = TRUE)

ggplot(d, aes(x=group, y=v)) +
   geom_boxplot(outlier.shape = NA,outlier.size =0,coef = 0)+
  theme(axis.text.x=element_text(angle=90))+
    geom_hline(yintercept = -0.07983455,color= "red") +
      geom_hline(yintercept =  0.3802926 ,color= "red") +
scale_y_continuous(limits = c( min(summary_stats$Q1)-.1, max(summary_stats$Q3)+.1 ))回答 1
Stack Overflow用户
回答已采纳
发布于 2018-12-04 19:53:24
如果您不使用scale_y_continuous部分,那么一切似乎都很好。看来这条线在某种程度上扰乱了胡须的计算。一种更安全的方法是使用coord_cartesian。例如
ggplot(d, aes(x=group, y=v)) +
  geom_boxplot(outlier.shape = NA,outlier.size =0,coef = 0)+
  theme(axis.text.x=element_text(angle=90))+
  geom_hline(yintercept = -0.07983455,color= "red") +
  geom_hline(yintercept =  0.3802926 ,color= "red") +
  coord_cartesian(ylim  = c( min(summary_stats$Q1)-.1,  max(summary_stats$Q3)+.1  ))
页面原文内容由Stack Overflow提供。腾讯云小微IT领域专用引擎提供翻译支持
原文链接:
https://stackoverflow.com/questions/53620377
复制相关文章
相似问题
腾讯云开发者

Copyright © 2013 - 2026 Tencent Cloud. All Rights Reserved. 腾讯云 版权所有
深圳市腾讯计算机系统有限公司 ICP备案/许可证号:粤B2-20090059 ![]() 粤公网安备44030502008569号
粤公网安备44030502008569号
腾讯云计算(北京)有限责任公司 京ICP证150476号 | 京ICP备11018762号