
更改“likert”标准文本
更改“likert”标准文本
提问于 2018-12-03 08:26:19
我不知道如何更改使用likert包创建的地块上的标准文本。
为了简单起见,我将只提供示例数据,因为解决方案可能是相同的。
library(likert)
data(pisaitems)
items28 <- pisaitems[, substr(names(pisaitems), 1, 5) == "ST24Q"]
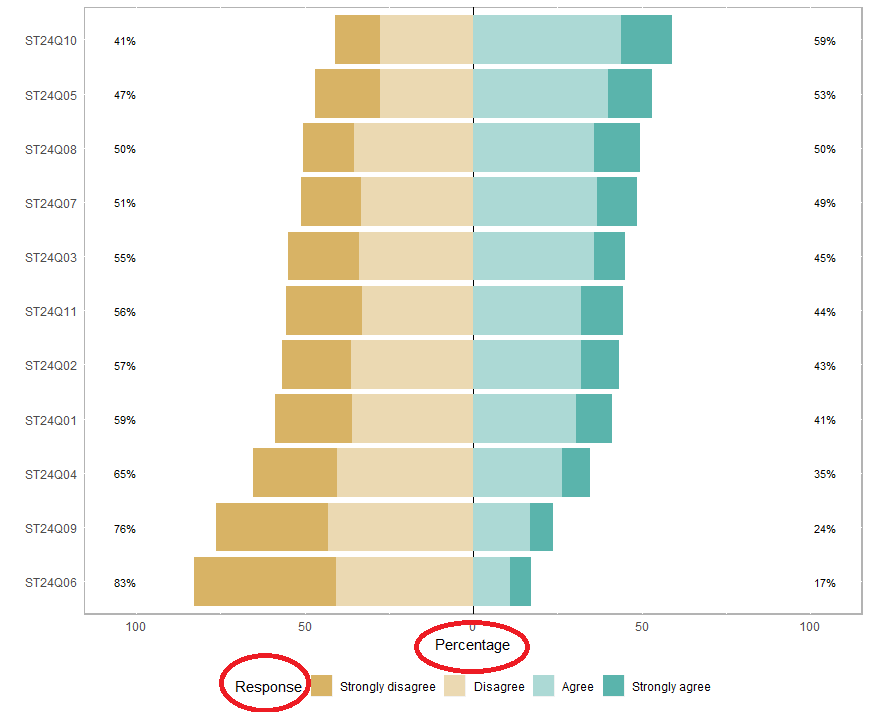
l28 <- likert(items28)
plot(l28)输出应该如下图所示,我想要更改的是“响应”和“百分比”。
希望你能帮忙!
回答 1
Stack Overflow用户
回答已采纳
发布于 2018-12-03 10:09:33
欢迎来到这里!我不知道likert包,但它的函数plot似乎是基于ggplot2的,所以您可以以ggplot2的方式修改选项:
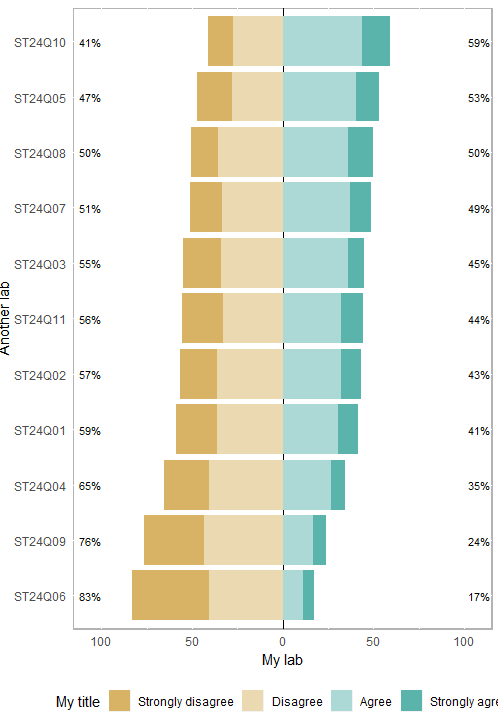
plot(l28) +
  labs(
    x = "Another lab",                          # here you manage axis
    y = "My lab"                                # also here ("inverted "because
                                                # it seems plot has coord_flip option)
  ) + guides(fill=guide_legend("My e title"))   # here you manage the title of the legend
页面原文内容由Stack Overflow提供。腾讯云小微IT领域专用引擎提供翻译支持
原文链接:
https://stackoverflow.com/questions/53589934
复制相关文章
相似问题
腾讯云开发者

Copyright © 2013 - 2026 Tencent Cloud. All Rights Reserved. 腾讯云 版权所有
深圳市腾讯计算机系统有限公司 ICP备案/许可证号:粤B2-20090059 ![]() 粤公网安备44030502008569号
粤公网安备44030502008569号
腾讯云计算(北京)有限责任公司 京ICP证150476号 | 京ICP备11018762号