
使用所有行作为基准行绘制交叉表结果
使用所有行作为基准行绘制交叉表结果
提问于 2018-11-25 12:01:34
我有这个数据样本:
test = pd.DataFrame({'cluster':['1','1','1','1','2','2','2','2','2','3','3','3'],
                 'type':['a','b','c','a','a','b','c','c','a','b','c','a']})
我使用交叉表生成一个新的数据和绘图结果:
pd.crosstab(test.cluster,test.type,normalize='index',margins=True).plot(kind='bar')
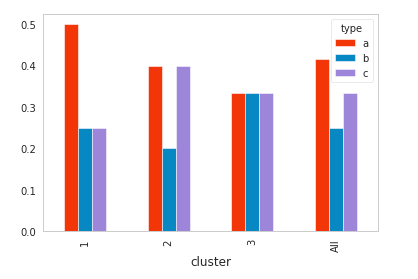
我想画的行都是点缀的水平基准线,颜色相同,对应于每一种类型,以提高对情节的理解。会感谢这个社区的帮助!
回答 1
Stack Overflow用户
回答已采纳
发布于 2018-11-25 12:19:10
import numpy as np
import pandas as pd
import matplotlib.pyplot as plt
test = pd.DataFrame(
{'cluster': ['1', '1', '1', '1', '2', '2', '2', '2', '2', '3', '3', '3'],
'type': ['a', 'b', 'c', 'a', 'a', 'b', 'c', 'c', 'a', 'b', 'c', 'a']})
tab = pd.crosstab(test.cluster, test.type, normalize='index', margins=True)
fig, ax = plt.subplots()
# find the default colors
prop_cycle = plt.rcParams['axes.prop_cycle']
colors = prop_cycle.by_key()['color']
# make a bar plot using all rows but the last
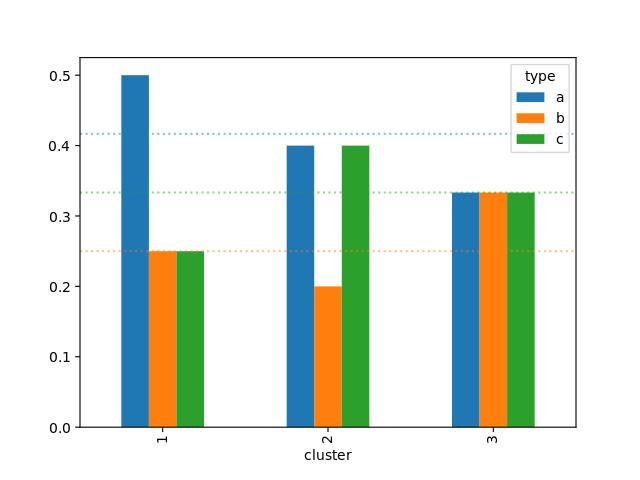
tab.iloc[:-1].plot(ax=ax, kind='bar', color=colors)
# draw the horizontal dotted lines
for y, c in zip(tab.loc['All'], colors):
ax.axhline(y=y, color=c, linestyle=':', alpha=0.5)
plt.show()
页面原文内容由Stack Overflow提供。腾讯云小微IT领域专用引擎提供翻译支持
原文链接:
https://stackoverflow.com/questions/53467225
复制相关文章
相似问题
腾讯云开发者

Copyright © 2013 - 2026 Tencent Cloud. All Rights Reserved. 腾讯云 版权所有
深圳市腾讯计算机系统有限公司 ICP备案/许可证号:粤B2-20090059 ![]() 粤公网安备44030502008569号
粤公网安备44030502008569号
腾讯云计算(北京)有限责任公司 京ICP证150476号 | 京ICP备11018762号