
Conway在Python 3中使用matplotlib的生命游戏--显示一个编队的问题
Conway在Python 3中使用matplotlib的生命游戏--显示一个编队的问题
提问于 2018-11-23 07:52:35
我目前正试图编程一个python 3实现的游戏生活。我的主要目标是显示一个大小为n的网格,按照conway的规则随机填充。那部分运作得很好。
现在我想实现第二种模式,允许你从一个给定的编队开始--在我的第一次尝试滑翔机。
这里是main():
import matplotlib.pyplot as plt
import matplotlib.animation as animation
from gol_functions import *

def main():

    # get arguments from input function
    arguments = input_arguments()
    # set the arguments
    gridsize = int(arguments.gridsize)
    interval = int(arguments.interval)
    formation = arguments.formationflag

    # if you want to start with a formation:
    if formation:
        grid = np.zeros(gridsize*gridsize).reshape(gridsize, gridsize)
        add_glider(1, 1, grid)

    # else display a randopm grid
    else:
        grid = randomgrid(gridsize)

    fig, ax = plt.subplots()

    # colormap: black -> alive, white -> dead
    img = ax.imshow(grid, cmap='binary', interpolation='nearest')

    # this will be used to save the animation in a later version
    ani = animation.FuncAnimation(fig, update, fargs=(img, grid, gridsize,),
                                  frames=10,
                                  interval=interval,
                                  save_count=50)

    # remove x and y - axis labels, numbers and ticks
    ax.axes.xaxis.set_ticklabels([])
    ax.axes.yaxis.set_ticklabels([])
    plt.xticks([])
    plt.yticks([])

    # plot the animated output
    plt.show()


    if __name__ == '__main__':
        main()
下面是添加滑翔机的函数:
def add_glider(i, j, grid):
    """adds a glider with top-left cell at (i, j)"""
    glider = np.array([[0,    0, 255],
                       [255,  0, 255],
                       [0,  255, 255]])

    grid[i:i+3, j:j+3] = glider
它在网格@位置1,1中添加一个滑翔机。
下面是我的更新功能:
def update(frameNum, img, grid, gridsize):
    """Updates the grid every time it is refreshed"""
    newgrid = grid.copy()
    for i in range(gridsize):
        for j in range(gridsize):
            # this formula considers the edge/boundary conditions that appear
            # every cell has to have 8 neighbouring cells
            # to implement this in a grid of size n we simply fold the 4 edges to each parallel edge
            # we'll end up with a cylinder first, then with a geometric shape called torus (google it.)
            total = int((grid[i, (j - 1) % gridsize] + grid[i, (j + 1) % gridsize] +
                         grid[(i - 1) % gridsize, j] + grid[(i + 1) % gridsize, j] +
                         grid[(i - 1) % gridsize, (j - 1) % gridsize] +
                         grid[(i - 1) % gridsize, (j + 1) % gridsize] +
                         grid[(i + 1) % gridsize, (j - 1) % gridsize] + grid[
                         (i + 1) % gridsize, (j + 1) % gridsize]) / 255)

        # apply conway's basic rules of the game of life for each cell
            if grid[i, j] == ON:
                if (total < 2) or (total > 3):
                    newgrid[i, j] = OFF
            else:
                if total == 3:
                    newgrid[i, j] = ON
                    # update data
                    img.set_data(newgrid)
                    grid[:] = newgrid[:]
                    return img,
但是,当我选择让它显示滑翔机时,我所看到的只是以下形式.
它很快就变成了静态的:
..。而不是在add_glider矩阵中看到的实际滑翔机。因此,似乎该程序在顶部添加了一个不需要的活细胞。我试着找出它的来源..。但我找不到。
有人有线索吗?我非常感谢大家的帮助。提前感谢!
回答 1
Stack Overflow用户
回答已采纳
发布于 2018-11-23 10:00:54
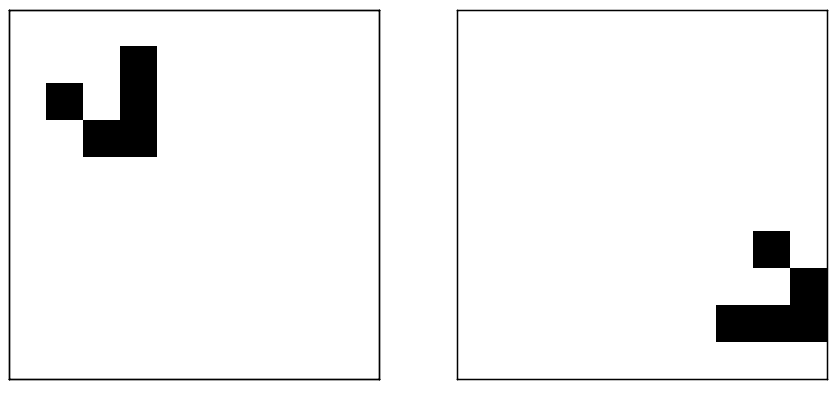
通过对原始帖子中的代码进行一些小的修正,我能够产生您想要的结果。修改后的代码列在底部。第一帧显示在图像下面的左边。经过几个帧,它看起来像在右边的图像。因此,滑翔机似乎工作得很好:)
#!/usr/bin/python
# call with: python3 cgl.py 10 500 1 1

import os
import argparse
import numpy as np
import matplotlib.pyplot as plt
from matplotlib import animation

ON = 255
OFF = 0


def update(frameNum, img, grid, gridsize):
    """Updates the grid every time it is refreshed"""
    newgrid = grid.copy()
    for i in range(gridsize):
        for j in range(gridsize):
            # this formula considers the edge/boundary conditions that appear
            # every cell has to have 8 neighbouring cells
            # to implement this in a grid of size n we simply fold the 4 edges to each parallel edge
            # we'll end up with a cylinder first, then with a geometric shape called torus (google it.)
            total = int((grid[i, (j - 1) % gridsize] + grid[i, (j + 1) % gridsize] +
                         grid[(i - 1) % gridsize, j] + grid[(i + 1) % gridsize, j] +
                         grid[(i - 1) % gridsize, (j - 1) % gridsize] +
                         grid[(i - 1) % gridsize, (j + 1) % gridsize] +
                         grid[(i + 1) % gridsize, (j - 1) % gridsize] + grid[
                         (i + 1) % gridsize, (j + 1) % gridsize]) / 255)

        # apply conway's basic rules of the game of life for each cell
            if grid[i, j] == ON:
                if (total < 2) or (total > 3):
                    newgrid[i, j] = OFF
            else:
                if total == 3:
                    newgrid[i, j] = ON
    # update data
    grid[:] = newgrid[:]
    img.set_data(newgrid)
    return img,


def add_glider(i, j, grid):
    """adds a glider with top-left cell at (i, j)"""
    glider = np.array([[0,    0, 255],
                       [255,  0, 255],
                       [0,  255, 255]])

    grid[i:i+3, j:j+3] = glider


def main():
    parser = argparse.ArgumentParser(description="Conway's game of life in Python 3")
    parser.add_argument('gridsize', type=int, help='Dimension of grid.')
    parser.add_argument('interval', type=int, help='Interval.')
    parser.add_argument('formationflag', type=bool, help='Predefined formation.')
    parser.add_argument('frame', type=int, help='How many frames to animate.')

    # get arguments from input function
    arguments = parser.parse_args()
    # set the arguments
    frame = int(arguments.frame)
    gridsize = int(arguments.gridsize)
    interval = int(arguments.interval)
    formation = arguments.formationflag

    # if you want to start with a formation:
    if formation:
        grid = np.zeros(gridsize*gridsize).reshape(gridsize, gridsize)
        add_glider(1, 1, grid)

    # else display a randopm grid
    else:
        grid = randomgrid(gridsize)

    fig, ax = plt.subplots()

    # colormap: black -> alive, white -> dead
    img = ax.imshow(grid, cmap='binary', interpolation='nearest')

    # # this will be used to save the animation in a later version
    ani = animation.FuncAnimation(fig, update, fargs=(img, grid, gridsize,),
                                  frames=frame,
                                  interval=interval,
                                  save_count=50)

    # remove x and y - axis labels, numbers and ticks
    ax.axes.xaxis.set_ticklabels([])
    ax.axes.yaxis.set_ticklabels([])
    plt.xticks([])
    plt.yticks([])

    # plot the animated output
    plt.show()

if __name__ == '__main__':
    main()
print("DONE")页面原文内容由Stack Overflow提供。腾讯云小微IT领域专用引擎提供翻译支持
原文链接:
https://stackoverflow.com/questions/53442614
复制相关文章
相似问题
腾讯云开发者

Copyright © 2013 - 2026 Tencent Cloud. All Rights Reserved. 腾讯云 版权所有
深圳市腾讯计算机系统有限公司 ICP备案/许可证号:粤B2-20090059 ![]() 粤公网安备44030502008569号
粤公网安备44030502008569号
腾讯云计算(北京)有限责任公司 京ICP证150476号 | 京ICP备11018762号