
如何用echarts将数字转换成货币?
如何用echarts将数字转换成货币?
提问于 2018-11-16 06:15:49
我想用echarts.js (v1) (https://ecomfe.github.io/)在图表中将数字转换成土耳其里拉货币。您可以在下面看到我的图表和echarts js代码。
我的图表:
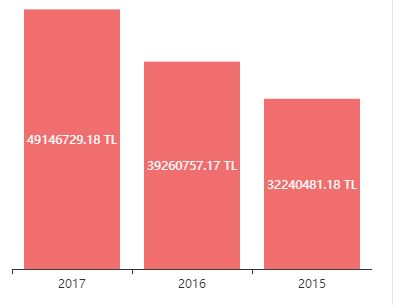
正如您可以看到的例子,数字是无法快速可读的。所以,我想把"49146729.18 TL“转换成"49.146.729,18 TL”。(在土耳其语中,我们使用“。”(点)用于分隔千,使用",“逗号分隔小数。
以下是我的echarts.js代码:
// based on prepared DOM, initialize echarts instance
var myChart = echarts.init(document.getElementById('Cirolar'));

// specify chart configuration item and data
var option = {
    color: ['#ef6e6e'],
    tooltip: {
        formatter: '{c} TL',
    },
    grid: {
        width: '100%',
        left: '0%',
        top: '1%',
        bottom: '1%',
        containLabel: true
    },
    xAxis: {
        data: ["2017", "2016", "2015"]
    },
    yAxis: {
        axisLine: {
            show: false
        },
        axisLabel: {
            show: false
        },
        axisTick: {
            show: false
        },
        splitLine: {
            show: false
        }
    },
    series: [{
        name: 'Ciro',
        type: 'bar',
        // data: [5, 20, 36, 10, 10, 20]
        data: [{
                value: price2017.replace(/,/g, '.'),
                name: '2017'
            },
            {
                value: price2016.replace(/,/g, '.'),
                name: '2016'
            },
            {
                value: price2015.replace(/,/g, '.'),
                name: '2015'
            }

        ],
        label: {
            normal: {
                formatter: '{c} TL',
                show: true,
                position: 'inside'
            },
        }
    }]
};

// use configuration item and data specified to show chart
myChart.setOption(option);更新:这里是jsfiddle链接:https://jsfiddle.net/johnvaldetine/wmxtLoyu/3/
回答 1
Stack Overflow用户
回答已采纳
发布于 2018-11-16 12:15:14
我检查了你的小提琴。似乎图表库提供了一个函数格式化程序。所以你可以这样用它:
function format(data)
{
    data = parseFloat(data);
    return data.toLocaleString('tr-TR', {style: 'currency', currency: 'TRY'});
}

... //Inside the options
formatter: function (params) {
        var val = format(params.value);
    return val;
}
...有关工作示例,请参阅此小提琴:https://jsfiddle.net/Lfrcbe9p/
页面原文内容由Stack Overflow提供。腾讯云小微IT领域专用引擎提供翻译支持
原文链接:
https://stackoverflow.com/questions/53332419
复制相关文章
相似问题
腾讯云开发者

Copyright © 2013 - 2026 Tencent Cloud. All Rights Reserved. 腾讯云 版权所有
深圳市腾讯计算机系统有限公司 ICP备案/许可证号:粤B2-20090059 ![]() 粤公网安备44030502008569号
粤公网安备44030502008569号
腾讯云计算(北京)有限责任公司 京ICP证150476号 | 京ICP备11018762号