
Matplotlib脊柱/轴切割
Matplotlib脊柱/轴切割
提问于 2018-11-10 14:55:30
matplotlib库在我的代码中得到了这样的结果:
ax.spines['top'].set_visible(False)
ax.spines['right'].set_visible(False)
ax.spines['bottom'].set_position('zero')
ax.spines['left'].set_position('zero')
它向我展示:
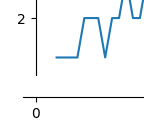
我还以为斧头会被砍呢!怎么切斧头?
下面是完整的代码:
import matplotlib.pyplot as plt

pgcd = lambda a, b: a if b==0 else pgcd(b, a%b)


def EKG(n):
    ekg = [1, 2]
    i = 2
    while i < n:
        j = 1
        while j in ekg or pgcd(j, ekg[i-1]) == 1:
            j += 1
        ekg.append(j)
        i += 1
    return ekg


supEKG = lambda n: sum(a>n for a in EKG(n))

arr = []
r = range(3, 100)
for n in r:
    arr.append(supEKG(n))


f = plt.figure()
ax = f.add_subplot(1,1,1)
ax.plot(r, arr)

ax.spines['top'].set_visible(False)
ax.spines['right'].set_visible(False)
ax.spines['bottom'].set_position('zero')
ax.spines['left'].set_position('zero')

plt.show()回答 2
Stack Overflow用户
回答已采纳
发布于 2018-11-10 15:56:05
看下面的样本,这将帮助你得到你想要的。
"""
Broken axis example, where the x-axis will have a portion cut out.
"""
import matplotlib.pylab as plt
import numpy as np

x = np.linspace(0, 10, 100)
x[75:] = np.linspace(40, 42.5, 25)

y = np.sin(x)

f, (ax, ax2) = plt.subplots(1, 2, sharey=True, facecolor='w')

# plot the same data on both axes
ax.plot(x, y)
ax2.plot(x, y)

ax.set_xlim(0, 7.5)
ax2.set_xlim(40, 42.5)

# hide the spines between ax and ax2
ax.spines['right'].set_visible(False)
ax2.spines['left'].set_visible(False)
ax.yaxis.tick_left()
ax.tick_params(labelright='off')
ax2.yaxis.tick_right()

# This looks pretty good, and was fairly painless, but you can get that
# cut-out diagonal lines look with just a bit more work. The important
# thing to know here is that in axes coordinates, which are always
# between 0-1, spine endpoints are at these locations (0,0), (0,1),
# (1,0), and (1,1).  Thus, we just need to put the diagonals in the
# appropriate corners of each of our axes, and so long as we use the
# right transform and disable clipping.

d = .015  # how big to make the diagonal lines in axes coordinates
# arguments to pass plot, just so we don't keep repeating them
kwargs = dict(transform=ax.transAxes, color='k', clip_on=False)
ax.plot((1 - d, 1 + d), (-d, +d), **kwargs)
ax.plot((1 - d, 1 + d), (1 - d, 1 + d), **kwargs)

kwargs.update(transform=ax2.transAxes)  # switch to the bottom axes
ax2.plot((-d, +d), (1 - d, 1 + d), **kwargs)
ax2.plot((-d, +d), (-d, +d), **kwargs)

# What's cool about this is that now if we vary the distance between
# ax and ax2 via f.subplots_adjust(hspace=...) or plt.subplot_tool(),
# the diagonal lines will move accordingly, and stay right at the tips
# of the spines they are 'breaking'

plt.show()这种方法是在断轴中实现的。
Stack Overflow用户
发布于 2021-09-19 00:08:53
您可以使用下垂脊柱
ax.spines.left.set_position(('outward', 10))

ax.spines.bottom.set_position(('outward', 10))页面原文内容由Stack Overflow提供。腾讯云小微IT领域专用引擎提供翻译支持
原文链接:
https://stackoverflow.com/questions/53240144
复制相关文章
相似问题
腾讯云开发者

Copyright © 2013 - 2026 Tencent Cloud. All Rights Reserved. 腾讯云 版权所有
深圳市腾讯计算机系统有限公司 ICP备案/许可证号:粤B2-20090059 ![]() 粤公网安备44030502008569号
粤公网安备44030502008569号
腾讯云计算(北京)有限责任公司 京ICP证150476号 | 京ICP备11018762号