
在两个x轴上显示的值,即使是plt.subplots(sharex = True)
在两个x轴上显示的值,即使是plt.subplots(sharex = True)
提问于 2018-11-07 01:13:46
我正在处理一组关于用水量的小数据。我有两个子图,我告诉他们分享他们的x轴,然而,图并不代表这个事实。当不使用这个数据集时,我可以将plt.subplots(sharex = True)用于绘图,这让我怀疑这是否是熊猫和matplotlib库之间的问题。我的代码很简单,如下所示:
import pandas as pd
import matplotlib.pyplot as plt
# Source = https://data.cityofnewyork.us/Environment/Water-Consumption-In-The-New-York-City/ia2d-e54m
data_loc = 'D:\CSVs\Water_Consumption_In_The_New_York_City.csv'
df = pd.read_csv(data_loc, parse_dates=True)
#editing the population data to be per million
df['New York City Population'] = df['New York City Population']/1000000
fig, (ax1,ax2) = plt.subplots(2, figsize=(8,5), sharex = True)
ax1 = plt.subplot(211)
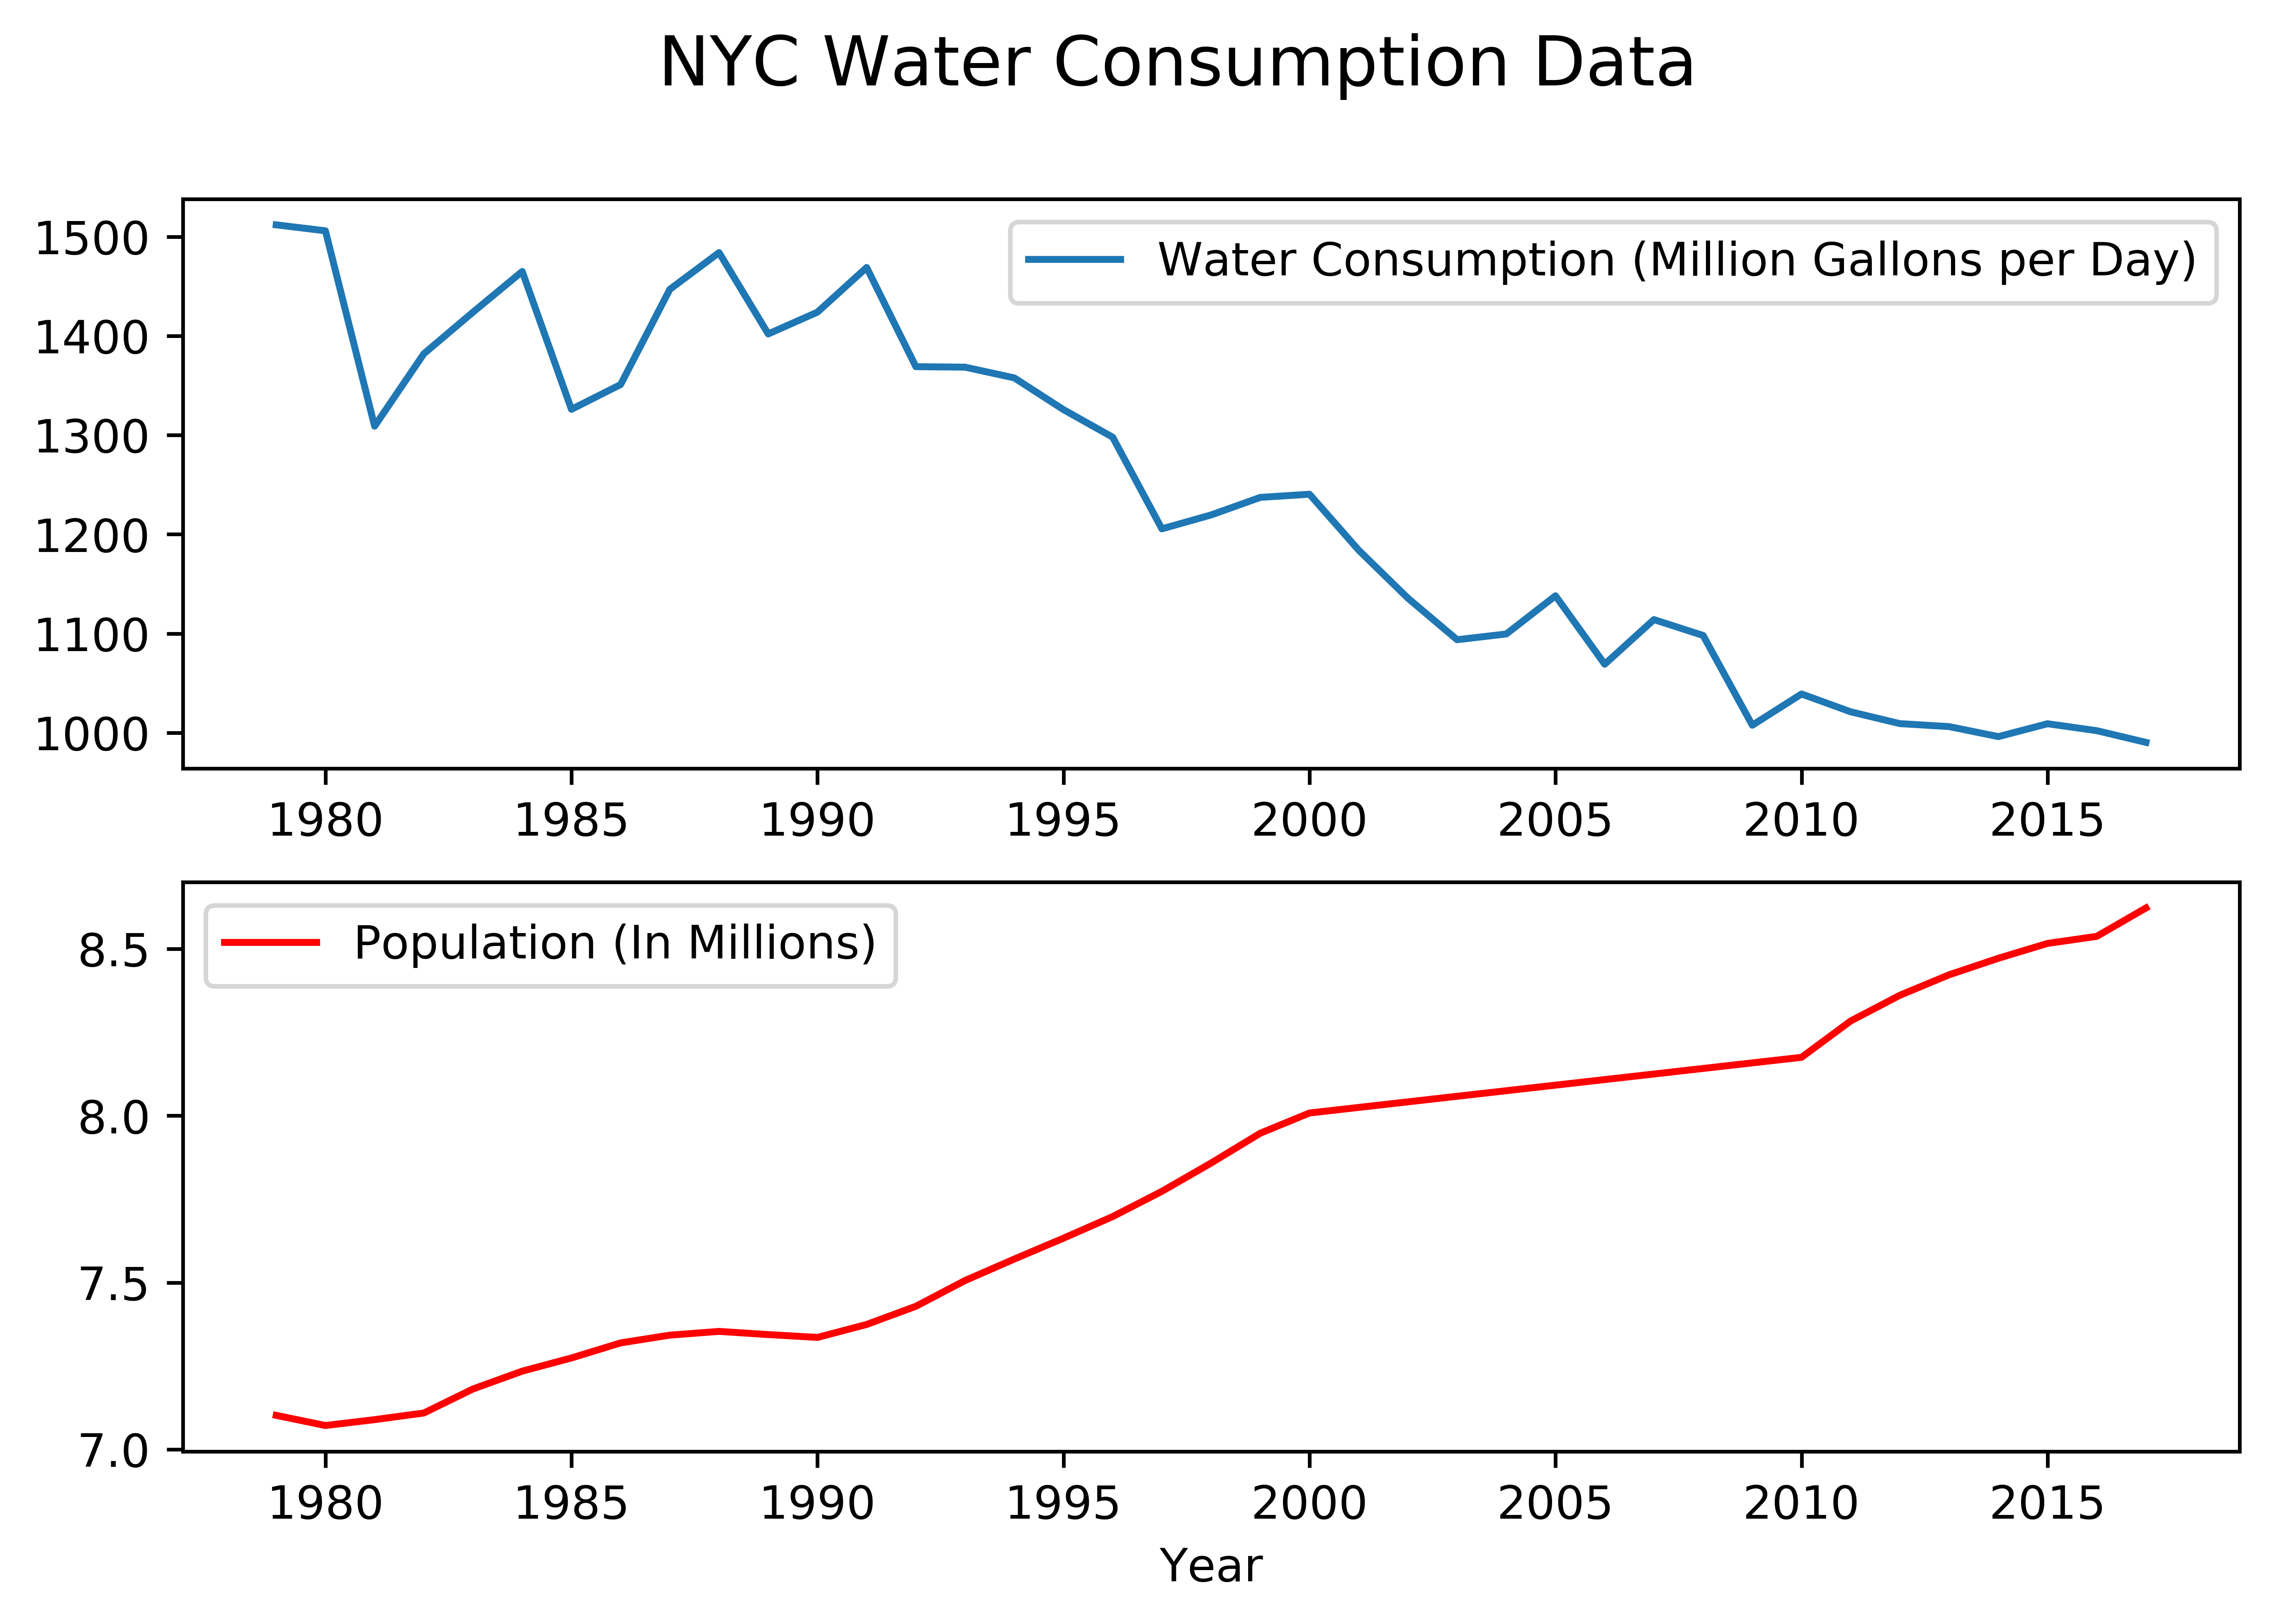
ax1.plot(df['Year'], df['NYC Consumption(Million gallons per day)'])
ax1.legend(['Water Consumption (Million Gallons per Day)'])
ax2 = plt.subplot(212)
ax2.plot(df['Year'], df['New York City Population'], color='red')
ax2.legend(['Population (In Millions)'])
plt.xlabel('Year')
plt.suptitle('NYC Water Consumption Data', size = 15)
plt.show()此代码生成这些图,它们不共享一个x轴:
提前谢谢你
回答 1
Stack Overflow用户
回答已采纳
发布于 2018-11-07 01:33:50
fig, (ax1,ax2) = plt.subplots(1,2, figsize=(8,5), sharex = True)是一行和两列,所以sharex没有意义。
ax1,ax2是子图,所以没有必要再次初始化它们
import pandas as pd
import matplotlib.pyplot as plt

data_loc = 'D:\CSVs\Water_Consumption_In_The_New_York_City.csv'
df = pd.read_csv(data_loc, parse_dates=True)
#editing the population data to be per million
df['New York City Population'] = df['New York City Population']/1000000

fig, (ax1,ax2) = plt.subplots(2, 1, figsize=(8,5), sharex = True)
ax1.plot(df['Year'], df['NYC Consumption(Million gallons per day)'])
ax1.legend(['Water Consumption (Million Gallons per Day)'])

ax2.plot(df['Year'], df['New York City Population'], color='red')
ax2.legend(['Population (In Millions)'])
plt.xlabel('Year')

plt.suptitle('NYC Water Consumption Data', size = 15)
plt.show()页面原文内容由Stack Overflow提供。腾讯云小微IT领域专用引擎提供翻译支持
原文链接:
https://stackoverflow.com/questions/53182406
复制相关文章
相似问题
腾讯云开发者

Copyright © 2013 - 2026 Tencent Cloud. All Rights Reserved. 腾讯云 版权所有
深圳市腾讯计算机系统有限公司 ICP备案/许可证号:粤B2-20090059 ![]() 粤公网安备44030502008569号
粤公网安备44030502008569号
腾讯云计算(北京)有限责任公司 京ICP证150476号 | 京ICP备11018762号