
如何在R中获取罐装类产品的数据分析
如何在R中获取罐装类产品的数据分析
提问于 2018-11-02 11:53:08
我使用罐装在R中执行某些计算,分析的输出存储在类uvtop的对象中。现在,我希望导出分析的结果,而不是仅仅在R窗口中绘制它。
下面是一个示例,使用来自这个包的示例数据。
data(ardieres)
events1 <- clust(ardieres, u = 6, tim.cond = 8/365, clust.max = TRUE)
npy <- length(events1[,"obs"]) / (diff(range(ardieres[,"time"], na.rm
= TRUE)) - diff(ardieres[c(20945,20947),"time"]))
mle <- fitgpd(events1[,"obs"], thresh = 6, est = "mle")
par(mfrow=c(2,2))
plot(mle, npy = npy)
通过这个,我得到了下面的图像:
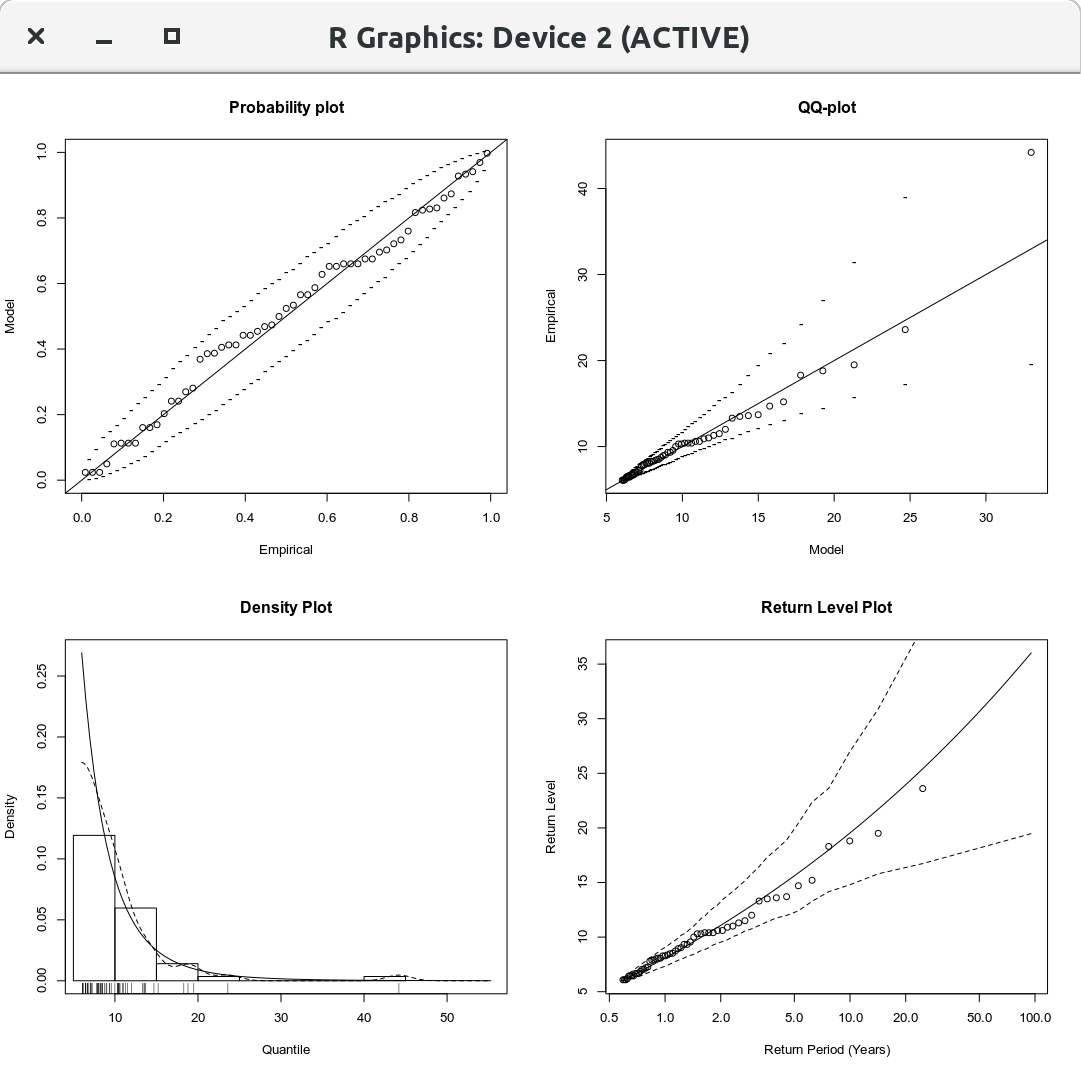
好的,但我想要的是导出必要的数据来再现返回级别图(右下角),即由圆圈、实线和双虚线表示的值。
回答 2
Stack Overflow用户
回答已采纳
发布于 2018-11-02 13:20:14
要获取为返回级别绘制的数据,我们必须深入研究retlev函数。基本上,我尽了最大的努力去掉所有的标绘,并构造出所需的点的data.frame。
getRetLevData <- function (fitted, npy) {
  data  <- fitted$exceed
  loc   <- fitted$threshold[1]
  scale <- fitted$param["scale"]
  shape <- fitted$param["shape"]
  n     <- fitted$nat

  pot.fun <- function(T) {
    p <- rp2prob(T, npy)[, "prob"]
    return(qgpd(p, loc, scale, shape))
  }

  eps <- 10^(-3)

  if (!is.null(fitted$noy)){
    npy <- n/fitted$noy
    } else if (missing(npy)) {
    warning("Argument ``npy'' is missing. Setting it to 1.")
    npy <- 1
  }

  xlimsup    <- prob2rp((n - 0.35)/n, npy)[, "retper"]
  fittedLine <- pot.fun(seq(1/npy + eps, xlimsup, length.out = n))
  p_emp      <- (1:n - 0.35)/n
  xPoints    <- 1/(npy * (1 - p_emp))
  empPoints  <- sort(data)
  samp       <- rgpd(1000 * n, loc, scale, shape)
  samp       <- matrix(samp, n, 1000)
  samp       <- apply(samp, 2, sort)
  samp       <- apply(samp, 1, sort)
  ci_inf     <- samp[25, ]
  ci_sup     <- samp[975, ]

  rst <- data.frame(xPoints, fittedLine, empPoints,
                    ci_inf, ci_sup)
}

x <- getRetLevData(mle, npy)
head(x)
#    fittedX fittedLine  xPoints empPoints   ci_inf   ci_sup
#1  1.001000   6.003716 1.011535      6.09 6.001557 6.239971
#2  3.891288  11.678503 1.029810      6.09 6.014536 6.363070
#3  6.781577  14.402517 1.048758      6.09 6.042065 6.470195
#4  9.671865  16.282306 1.068416      6.19 6.074348 6.583290
#5 12.562153  17.740710 1.088825      6.44 6.114193 6.684118
#6 15.452441  18.942354 1.110029      6.45 6.146098 6.812058
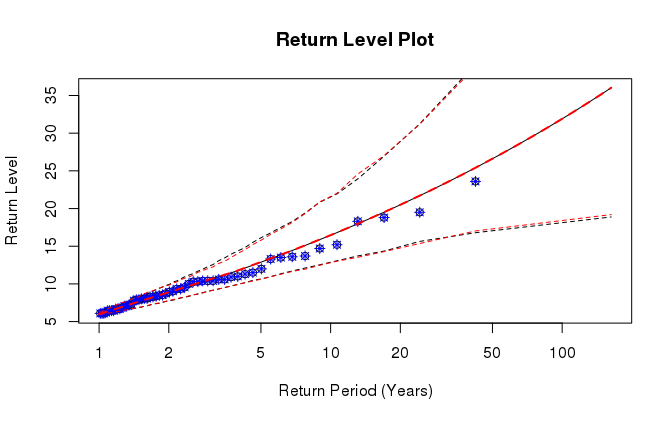
write.csv(x, "my_pot_results.csv")提取的数据与retlev图的叠加。因为取样的缘故,CI有点不一样。
Stack Overflow用户
发布于 2018-11-02 12:24:26
如果您不想用R以外的其他应用程序读取该文件,只需将其保存在:
save(mle, file="myfilename.Rdata")或
saveRDS(mle, file="myfilename.Rds") 若要将其读入,请加载生成数据的库,然后使用
load("myfilename.Rdata")若要将对象加载回工作区或
mle <- readRDS("myfilename.Rds")根据库的实现方式,save与对象一起保存的环境比saveRDS更多,这可能会产生不同的效果。除非数据集太大,否则我建议使用save。
页面原文内容由Stack Overflow提供。腾讯云小微IT领域专用引擎提供翻译支持
原文链接:
https://stackoverflow.com/questions/53118113
复制相关文章
相似问题
腾讯云开发者

Copyright © 2013 - 2026 Tencent Cloud. All Rights Reserved. 腾讯云 版权所有
深圳市腾讯计算机系统有限公司 ICP备案/许可证号:粤B2-20090059  粤公网安备44030502008569号
腾讯云计算(北京)有限责任公司 京ICP证150476号 | 京ICP备11018762号