
如何使用数据帧中的标记来子集超帧的模式
我有一个93行的超帧。每一行都包含类ppp树的树状图以及地块级别的分组因素。标记的数据提供了点特定的数据,例如每个点的直径、种类和高度。我需要根据标记的数据对点模式进行子集,然后运行need函数,它需要将数据集合起来。我已经找到了基于超帧列的单点模式的子设置标记和基于列的超帧的子设置示例,但我还没有看到从具有多个标记的dataframe中调用一个因子的元素级别的例子。如有任何指导,将不胜感激。
我可以将超帧按地块水平因子进行子集,例如a、b和c植被类型,然后对每个地块运行一个Lest,根据植被类型将输出集中起来,并绘制集合Lest (pg )。684的Baddeley等人。2015年提供了一个有用的例子)。
但是,我无法根据数据帧的特定标记对超帧的点模式进行子集。我不确定数据的结构是否会导致问题,所以我已经在下面介绍了,或者我只是混淆了设置与超级帧的多点模式相关联的数据帧的标记的代码(这里是R新手)。列表中的列表变得令人困惑)。
数据结构:
    z.list <- mapply(as.ppp, X = df.list, W = window.list, SIMPLIFY=FALSE)
     #df.list contains x,y coordinates, followed by columns of point specific
      #data.
    h <- hyperframe(X=z.list)
    H <- cbind.hyperframe(h, plot.df1)#combine the point pattern and marks
     #with plot level data
数据结构:
     str(H)
    'hyperframe':    93 rows and 14 columns
     $ X : objects of class ppp
     $ PLOTID : factor 0102U001 0104U001 0104U002 ...
     $ Group1 : integer 1 2 1 ...
     $ Group2 : numeric 2.0 2.5 2.0 ...

    str(H[1,]$X) #str of the ppp of the hyperframes first row
    List of 1
    $ X:List of 6
    ..$ window    :List of 5
    .. ..$ type  : chr "polygonal"
    .. ..$ xrange: num [1:2] 516441 516503
    .. ..$ yrange: num [1:2] 3382698 3382804
    .. ..$ bdry  :List of 1
    .. .. ..$ :List of 2
    .. .. .. ..$ x: num [1:4] 516503 516502 516441 516442
    .. .. .. ..$ y: num [1:4] 3382698 3382804 3382804 3382698
    .. ..$ units :List of 3
    .. .. ..$ singular  : chr "metre"
    .. .. ..$ plural    : chr "metres"
    .. .. ..$ multiplier: num 1
    .. .. ..- attr(*, "class")= chr "unitname"
    .. ..- attr(*, "class")= chr "owin"
    ..$ n         : int 107
    ..$ x         : num [1:107] 516501 516473 516470 516474 516474 ...
    ..$ y         : num [1:107] 3382801 3382723 3382726 3382734 3382732 ...
    ..$ markformat: chr "dataframe"
    ..$ marks     :'data.frame':    107 obs. of  3 variables:
    .. ..$ DBH_Class: Factor w/ 16 levels "11.25","13.75",..: 7 5 13 12 8 4 9
    .. ..$ Ingrowth : Factor w/ 7 levels "DD","I_DD","I_LD_MY",..: 7 6 6 7
    .. ..$ PlotID    : Factor w/ 93 levels "0102U001","0104U001",..: 1 1 1 1
    ..- attr(*, "class")= chr "ppp"
- attr(*, "class")= chr [1:5] "ppplist" "solist" "anylist" "listof" ...上面的内容在我看来是正确的,但我注意到,虽然标记与str函数一起打印,但is.multipoint输出为FALSE。不知道这是不是我的问题。对于位于超级帧的行中的绘图级别因素,以下内容非常有用。
    H$L <- with(H, Lest((X),rmax=40))
    L.VT.split <- split(H$L, H$VEG_TYPE) #plot level factor
    L.VT.pool <- anylapply(L.VT.split, pool)
    plot(L.VT.pool,cbind(pooliso, pooltheo, hiiso,loiso)-r~r,
      shade=c("hiiso","loiso"),equal.scales=TRUE, main='')
但是如何使用数据文件中的标记来执行相同的操作呢?
回答 1
Stack Overflow用户
发布于 2018-10-30 08:32:26
我不确定我是否完全理解这个问题,但我会尽力提供一些有用的提示.
对于H中的每一行,都有一个点模式,其中包含data.frame中的标记信息(名为DBH_Class、Ingrowth和PlotID的三列)。下面是一些具有这种结构的假数据:
library(spatstat)
set.seed(42)
df1 <- data.frame(x = runif(3), y = runif(3), DBH_Class = factor(1:3),
                  Ingrowth = LETTERS[1:3], PlotID = letters[1:3])
X1 <- as.ppp(df1, W = square(1))
df2 <- data.frame(x = runif(3), y = runif(3), DBH_Class = factor(1:3),
                  Ingrowth = LETTERS[1:3], PlotID = letters[1:3])
X2 <- as.ppp(df2, W = square(1))
H <- hyperframe(X = list(X1 = X1, X2 = X2))
H
#> Hyperframe:
#>       X
#> 1 (ppp)
#> 2 (ppp)
plot(H$X, which.marks = "Ingrowth")
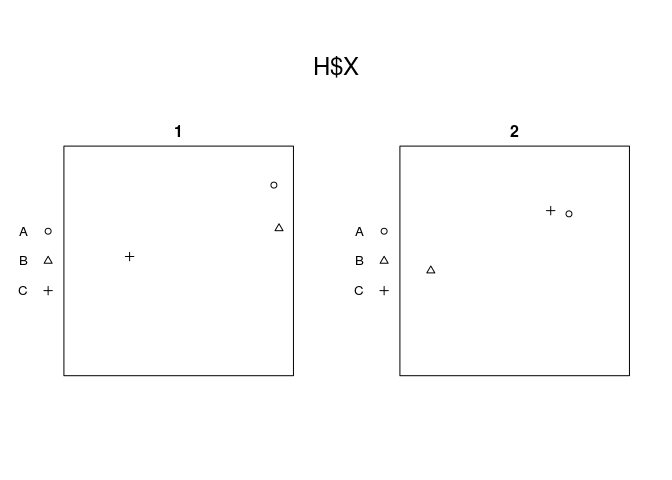
若要按特定标记(本例中为Ingrowth)对单个点模式进行子集,请使用subset
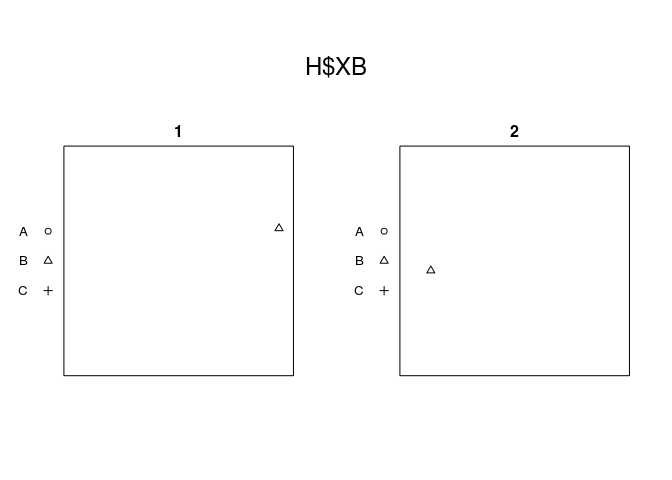
X1B <- subset(X1, Ingrowth == "B")列X中的每个模式在H中的相同之处
H$XB <- with(H, subset(X, Ingrowth == "B"))
H
#> Hyperframe:
#>       X    XB
#> 1 (ppp) (ppp)
#> 2 (ppp) (ppp)
plot(H$XB, which.marks = "Ingrowth")
https://stackoverflow.com/questions/53054198
复制相似问题
腾讯云开发者

Copyright © 2013 - 2026 Tencent Cloud. All Rights Reserved. 腾讯云 版权所有
深圳市腾讯计算机系统有限公司 ICP备案/许可证号:粤B2-20090059 ![]() 粤公网安备44030502008569号
粤公网安备44030502008569号
腾讯云计算(北京)有限责任公司 京ICP证150476号 | 京ICP备11018762号