
使用Matplotlib-Basemap和Xarray绘制lat/lon网格线
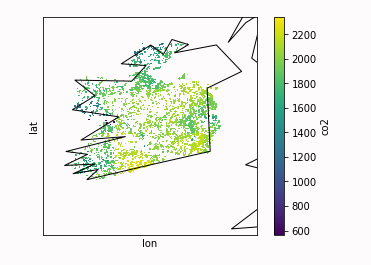
我有一个xarray DataArray da,它包含爱尔兰的一部分数据,如下所示:
<xarray.DataArray 'co2' (lat: 733, lon: 720)>
array([[nan, nan, nan, ..., nan, nan, nan],
   [nan, nan, nan, ..., nan, nan, nan],
   [nan, nan, nan, ..., nan, nan, nan],
   ...,
   [nan, nan, nan, ..., nan, nan, nan],
   [nan, nan, nan, ..., nan, nan, nan],
   [nan, nan, nan, ..., nan, nan, nan]])
Coordinates:
  * lat      (lat) float32 49.9 49.908333 49.916664 49.924995 49.933327 ...
  * lon      (lon) float32 -11.0 -10.991667 -10.983334 -10.975 -10.966667 ...
我可以这样描绘它:
import matplotlib.pyplot as plt
import xarray
import os
from mpl_toolkits.basemap import Basemap, cm

m= Basemap(projection='cyl',lat_0=ds.co2.lat[0],lon_0=ds.co2.lon[len(ds.co2.lon)/2])
m.drawcoastlines()
da.plot()
问题是,lat/lon网格线不会绘制。
当我使用经络命令时:
meridians = np.arange(10.,351.,20.)
m.drawmeridians(meridians,labels=[True,False,False,True])
我得到以下错误:
ValueError: dimensions () must have the same length as the number of data dimensions, ndim=1我不知道下一步该做什么。
编辑:完全错误跟踪:
---------------------------------------------------------------------------
ValueError                                Traceback (most recent call last)
<ipython-input-46-45a293c8bb99> in <module>()
  4
  5 # draw grid plots
----> 6 m.drawmeridians(np.arange(-8.0,2.0,1.0),labels=[1,0,0,0]) #longitudes
      7 m.drawparallels(np.arange(51.0,59.0,1.0),labels=[0,0,0,1]) #latitudes
      8

C:\Users\AppData\Local\Continuum\Anaconda\lib\site-    packages\mpl_toolkits\basemap\__init__.pyc in drawmeridians(self, meridians, color, linewidth, zorder, dashes, labels, labelstyle, fmt, xoffset, yoffset, ax, latmax, **kwargs)
   2593             # don't really know why, but this appears to be needed to
   2594             # or lines sometimes don't reach edge of plot.
-> 2595             testx = np.logical_and(x>=self.xmin-3*xdelta,x<=self.xmax+3*xdelta)
   2596             x = np.compress(testx, x)
   2597             y = np.compress(testx, y)

C:\Users\\AppData\Local\Continuum\Anaconda\lib\site-packages\xarray\core\dataarray.pyc in func(self, other)
   1550
   1551             variable = (f(self.variable, other_variable)
-> 1552                         if not reflexive
   1553                         else f(other_variable, self.variable))
   1554             coords = self.coords._merge_raw(other_coords)

C:\Users\\AppData\Local\Continuum\Anaconda\lib\site-packages\xarray\core\variable.pyc in func(self, other)
   1164                         if not reflexive
   1165                         else f(other_data, self_data))
-> 1166             result = Variable(dims, new_data)
   1167             return result
   1168         return func

C:\Users\\AppData\Local\Continuum\Anaconda\lib\site-packages\xarray\core\variable.pyc in __init__(self, dims, data, attrs, encoding, fastpath)
    255         """
    256         self._data = as_compatible_data(data, fastpath=fastpath)
--> 257         self._dims = self._parse_dimensions(dims)
    258         self._attrs = None
    259         self._encoding = None

C:\Users\\AppData\Local\Continuum\Anaconda\lib\site-packages\xarray\core\variable.pyc in _parse_dimensions(self, dims)
    364             raise ValueError('dimensions %s must have the same length as the '
    365                              'number of data dimensions, ndim=%s'
--> 366                              % (dims, self.ndim))
    367         return dims
    368

ValueError: dimensions () must have the same length as the number of data dimensions, ndim=1回答 2
Stack Overflow用户
发布于 2018-11-06 07:58:09
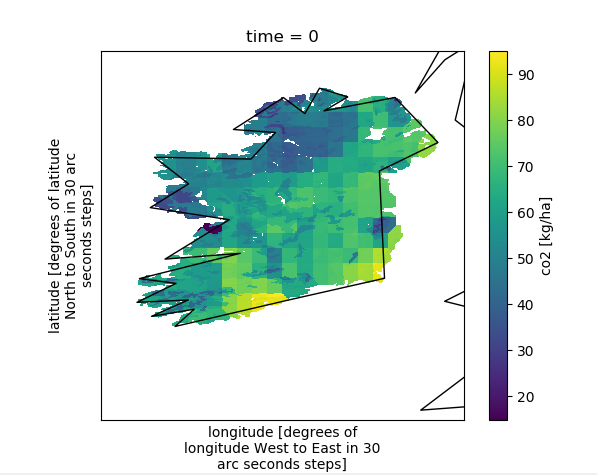
TL:我对你的数据集使用你的代码没有问题,让我们来找出原因
我使用了你的小数据集,这段代码:
ds=xarray.open_dataset(r"C:\Users\SHIR\Downloads\OneYear.nc")
da=ds.co2
m= Basemap(projection='cyl',lat_0=ds.co2.lat[0],lon_0=ds.co2.lon[len(ds.co2.lon)/2])
m.drawcoastlines()
da.plot()
plt.show()
我得到了这个图表:
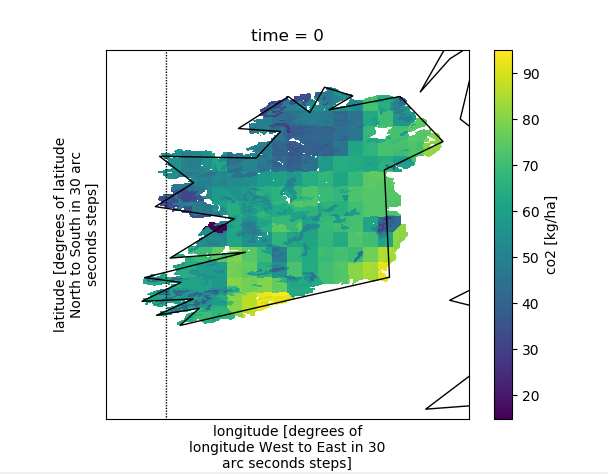
在添加经络时,使用:
ds=xarray.open_dataset(r"C:\Users\SHIR\Downloads\OneYear.nc")
da=ds.co2
m= Basemap(projection='cyl',lat_0=ds.co2.lat[0],lon_0=ds.co2.lon[len(ds.co2.lon)/2])
m.drawcoastlines()
meridians = np.arange(10.,351.,20.)
m.drawmeridians(meridians,labels=[True,False,False,True])
da.plot()
plt.show()
我有-
我能想到的事情导致了我们之间的差异:
首先--较小的数据集--请尝试您发送给我的较小的数据集,如果再次收到错误,请通知我。
第二个包和版本-我使用python2.7。我以前没有基本地图,所以我试着用conda安装它,有很多问题。最后,我使用conda (conda uninstall matplotlib)卸载matplotlib,使用pip (pip install matplotlib --upgrade --force-reinstall)重新安装matplotlib,并像这个答案中描述的那样手动安装basemap。我使用了basemap‑1.2.0‑cp27‑cp27m‑win_amd64.whl文件。
我真的不确定这是否明智,我也没有把康达搞得一团糟,但这是唯一对我有用的事情。也许只试着卸载basemap,而不是先卸载matplotlib (我这么做是因为我已经搞砸了.)
https://stackoverflow.com/questions/52968629
复制相似问题
腾讯云开发者

Copyright © 2013 - 2026 Tencent Cloud. All Rights Reserved. 腾讯云 版权所有
深圳市腾讯计算机系统有限公司 ICP备案/许可证号:粤B2-20090059 ![]() 粤公网安备44030502008569号
粤公网安备44030502008569号
腾讯云计算(北京)有限责任公司 京ICP证150476号 | 京ICP备11018762号