
在matplotlib中用两轴绘制三类
在matplotlib中用两轴绘制三类
提问于 2018-10-15 21:18:34
我使用熊猫和matplotlib的组合来绘制几个类别的三个值。我希望有一个图解有自己的轴线,而另两个则共享一个轴。
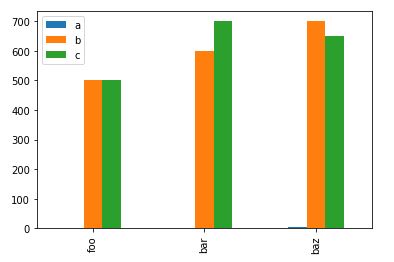
关闭,但说明了为什么我需要双轴:
pd.DataFrame([[1,2,3], [500,600,700], [500, 700, 650]], columns=['foo', 'bar','baz'],
             index=['a','b','c']).T.plot(kind='bar')
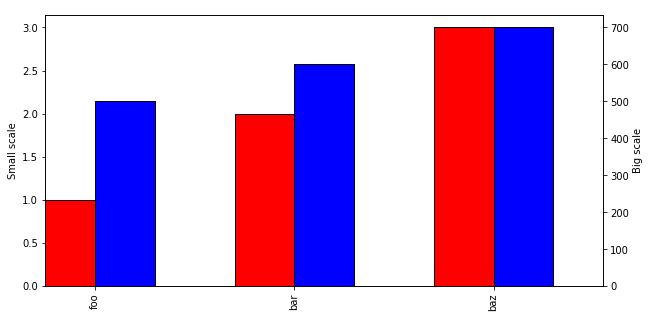
相反,我想要a条的第二个轴。我的尝试:
smol = pd.DataFrame([[1,2,3], [500,600,700], [500, 700, 650]], columns=['foo', 'bar','baz'],
        index=['a','b','c']).T

fig = plt.figure(figsize=(10,5)) # Create matplotlib figure

ax = fig.add_subplot(111) # Create matplotlib axes
ax2 = ax.twinx() # Create another axes that shares the same x-axis as ax.

smol['a'].plot(kind='bar', color='red', ax=ax, width=0.3,
                    position=1, edgecolor='black')
smol['b'].plot(kind='bar', color='blue', ax=ax2, width=0.3,
                 position=0, edgecolor='black')

ax.set_ylabel('Small scale')
ax2.set_ylabel('Big scale')

plt.show()
不幸的是,添加
smol['c'].plot(kind='bar', color='green', ax=ax2, width=0.3,
                 position=0, edgecolor='black')
生产:
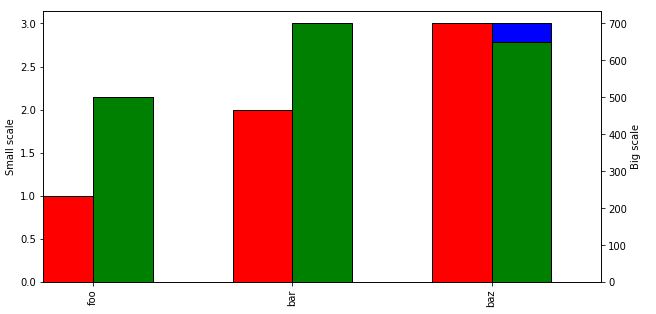
我怎么能让b和c共享一个轴,但是像第一次尝试时那样出现在彼此旁边呢?
回答 1
Stack Overflow用户
回答已采纳
发布于 2018-10-15 21:49:37
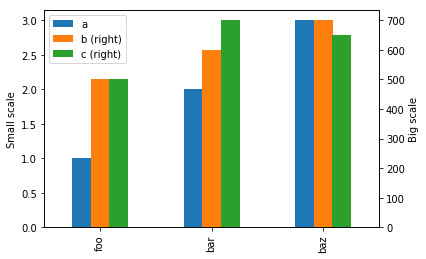
我使用过secondary_y关键字。代码也短得多。
smol = pd.DataFrame([[1,2,3], [500,600,700], [500, 700, 650]], columns=['foo', 'bar','baz'],
        index=['a','b','c']).T

ax = smol.plot(kind="bar", secondary_y=['b', 'c'])

ax.set_ylabel('Small scale')
ax.right_ax.set_ylabel('Big scale')

plt.show()
页面原文内容由Stack Overflow提供。腾讯云小微IT领域专用引擎提供翻译支持
原文链接:
https://stackoverflow.com/questions/52824897
复制相关文章
相似问题
腾讯云开发者

Copyright © 2013 - 2026 Tencent Cloud. All Rights Reserved. 腾讯云 版权所有
深圳市腾讯计算机系统有限公司 ICP备案/许可证号:粤B2-20090059 ![]() 粤公网安备44030502008569号
粤公网安备44030502008569号
腾讯云计算(北京)有限责任公司 京ICP证150476号 | 京ICP备11018762号