
使用Python库生成有向图任何python库
使用Python库生成有向图任何python库
提问于 2018-10-08 16:37:06
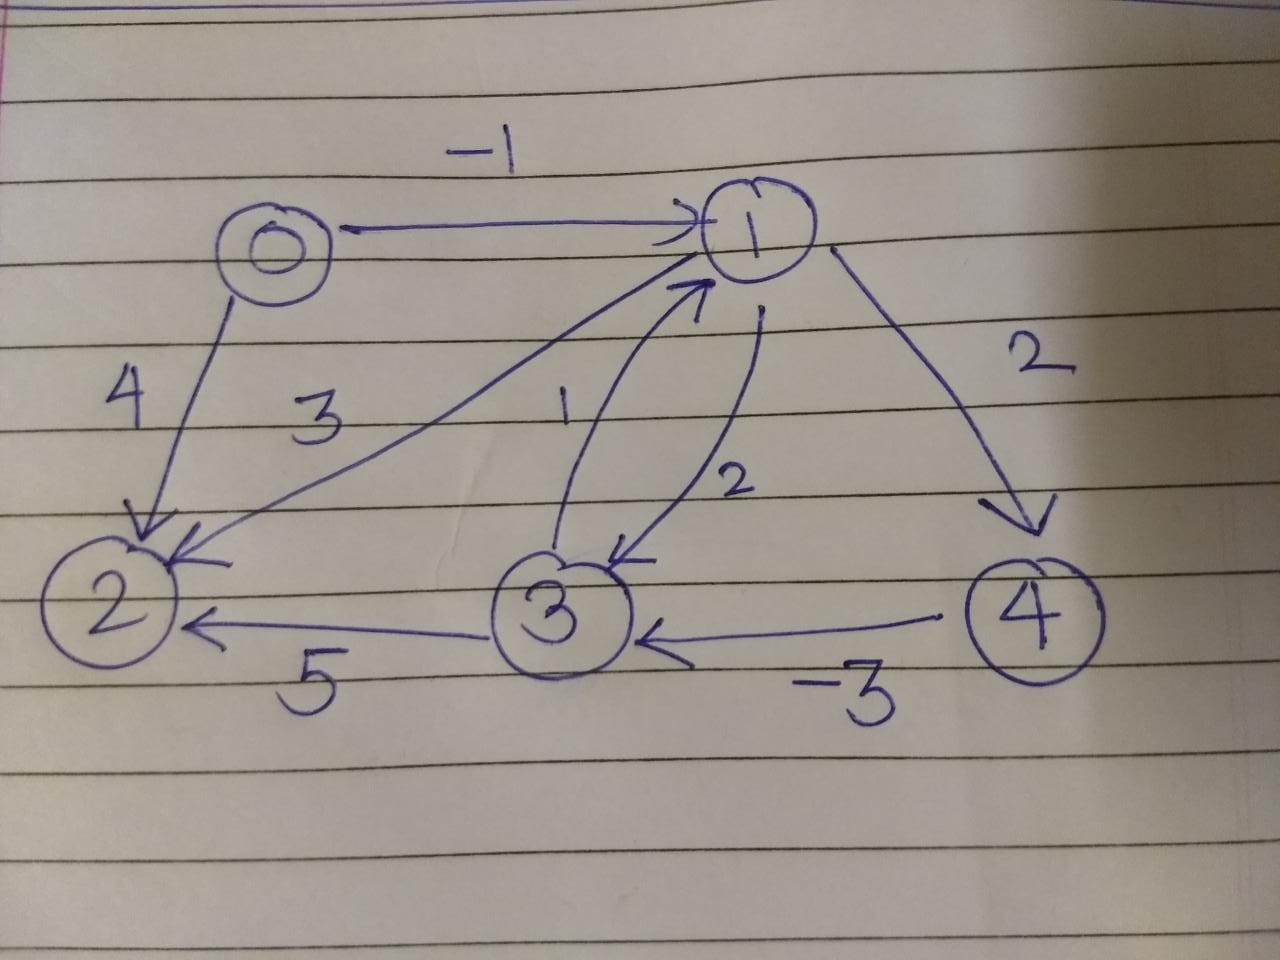
我正在用Python实现GeeksForGeeks中的Bellman算法。我想要使用一些库来生成图(诊断形式,而不是字典类型--这很容易),比如pyplot或networkx或类似的东西。我希望图形UI包含节点、边和相应的成本。
from collections import defaultdict

#Class to represent a graph
class Graph:

    def __init__(self,vertices):
        self.V= vertices #No. of vertices
        self.graph = [] # default dictionary to store graph

    # function to add an edge to graph
    def addEdge(self,u,v,w):
        self.graph.append([u, v, w])

    # utility function used to print the solution
    def printArr(self, dist):
        print("Vertex   Distance from Source")
        for i in range(self.V):
            print("%d \t\t %d" % (i, dist[i]))

    # The main function that finds shortest distances from src to
    # all other vertices using Bellman-Ford algorithm.  The function
    # also detects negative weight cycle
    def BellmanFord(self, src):

        # Step 1: Initialize distances from src to all other vertices
        # as INFINITE
        dist = [float("Inf")] * self.V
        dist[src] = 0


        # Step 2: Relax all edges |V| - 1 times. A simple shortest
        # path from src to any other vertex can have at-most |V| - 1
        # edges
        for i in range(self.V - 1):
            # Update dist value and parent index of the adjacent vertices of
            # the picked vertex. Consider only those vertices which are still in
            # queue
            for u, v, w in self.graph:
                if dist[u] != float("Inf") and dist[u] + w < dist[v]:
                        dist[v] = dist[u] + w

        # Step 3: check for negative-weight cycles.  The above step
        # guarantees shortest distances if graph doesn't contain
        # negative weight cycle.  If we get a shorter path, then there
        # is a cycle.

        for u, v, w in self.graph:
                if dist[u] != float("Inf") and dist[u] + w < dist[v]:
                        print "Graph contains negative weight cycle"
                        return

        # print all distance
        self.printArr(dist)

g = Graph(5)
g.addEdge(0, 1, -1)
g.addEdge(0, 2, 4)
g.addEdge(1, 2, 3)
g.addEdge(1, 3, 2)
g.addEdge(1, 4, 2)
g.addEdge(3, 2, 5)
g.addEdge(3, 1, 1)
g.addEdge(4, 3, -3)
我想要的终端或单独文件中的图形是(基于上面的代码):
回答 2
Stack Overflow用户
回答已采纳
发布于 2018-10-09 19:09:19
ekiim提供的文档链接非常有用。这是我绘制图形的代码:
import networkx as nx
import matplotlib.pyplot as plt
G=nx.DiGraph()
G.add_node(0),G.add_node(1),G.add_node(2),G.add_node(3),G.add_node(4)
G.add_edge(0, 1),G.add_edge(1, 2),G.add_edge(0, 2),G.add_edge(1, 4),G.add_edge(1, 3),G.add_edge(3, 2),G.add_edge(3,1),G.add_edge(4,3)
nx.draw(G, with_labels=True, font_weight='bold')
plt.show()
这段代码免费打印有向图。我试着用成本印刷,但产出因成本混乱而被严重扭曲。有些费用是用空格写成的,而边缘只有一两笔。因此,如果有人知道实现,这将是非常有用的。
页面原文内容由Stack Overflow提供。腾讯云小微IT领域专用引擎提供翻译支持
原文链接:
https://stackoverflow.com/questions/52706635
复制相关文章
相似问题
腾讯云开发者

Copyright © 2013 - 2026 Tencent Cloud. All Rights Reserved. 腾讯云 版权所有
深圳市腾讯计算机系统有限公司 ICP备案/许可证号:粤B2-20090059 ![]() 粤公网安备44030502008569号
粤公网安备44030502008569号
腾讯云计算(北京)有限责任公司 京ICP证150476号 | 京ICP备11018762号