
小面内的r ggplot2小面
小面内的r ggplot2小面
提问于 2018-10-05 06:23:36
问题
我试图绘制一个时间序列来回答调查中的问题。
id只是行号
question_id是每一次调查每天询问的问题号(由11个问题组成)
category_id是问题的范畴->这是我想要可视化到面中的变量
然而,在第1、第3和第5类中,提出的问题不止一个。
我希望将小面数1、3和5分别分解为2、3和2行,这样我就可以清楚地看到对不同的question_id数的响应。
可复制数据
id <- 1:55

question_id <- structure(c(1L, 2L, 3L, 4L, 5L, 6L, 7L, 8L, 9L, 10L, 11L, 1L,
                           2L, 3L, 4L, 5L, 6L, 7L, 8L, 9L, 10L, 11L, 1L, 2L, 3L, 4L, 5L,
                           6L, 7L, 8L, 9L, 10L, 11L, 1L, 2L, 3L, 4L, 5L, 6L, 7L, 8L, 9L,
                           10L, 11L, 1L, 2L, 3L, 4L, 5L, 6L, 7L, 8L, 9L, 10L, 11L),
                         .Label = c("1", "2", "3", "4", "5", "6", "7", "8", "9", "10", "11"),
                         class = "factor")


category_id <- structure(c(1L, 1L, 2L, 3L, 3L, 3L, 4L, 5L, 5L, 6L, 7L, 1L, 1L,
                           2L, 3L, 3L, 3L, 4L, 5L, 5L, 6L, 7L, 1L, 1L, 2L, 3L, 3L, 3L, 4L,
                           5L, 5L, 6L, 7L, 1L, 1L, 2L, 3L, 3L, 3L, 4L, 5L, 5L, 6L, 7L, 1L,
                           1L, 2L, 3L, 3L, 3L, 4L, 5L, 5L, 6L, 7L), .Label = c("1", "2",
                                                                               "3", "4", "5", "6", "7"), class = "factor")


date <- structure(c(24L, 24L, 24L, 24L, 24L, 24L, 24L, 24L, 24L, 24L,
                    24L, 30L, 30L, 30L, 30L, 30L, 30L, 30L, 30L, 30L, 30L, 30L, 33L,
                    33L, 33L, 33L, 33L, 33L, 33L, 33L, 33L, 33L, 33L, 36L, 36L, 36L,
                    36L, 36L, 36L, 36L, 36L, 36L, 36L, 36L, 39L, 39L, 39L, 39L, 39L,
                    39L, 39L, 39L, 39L, 39L, 39L), .Label = c("", "1/07/2017", "1/08/2017",
                                                              "1/09/2017", "10/07/2017", "10/08/2017", "10/09/2017", "11/07/2017",
                                                              "11/08/2017", "12/07/2017", "12/08/2017", "13/07/2017", "13/08/2017",
                                                              "14/07/2017", "14/08/2017", "15/07/2017", "15/08/2017", "16/07/2017",
                                                              "16/08/2017", "17/07/2017", "17/08/2017", "18/07/2017", "18/08/2017",
                                                              "19/06/2017", "19/07/2017", "19/08/2017", "2/07/2017", "2/08/2017",
                                                              "2/09/2017", "20/06/2017", "20/07/2017", "20/08/2017", "21/06/2017",
                                                              "21/07/2017", "21/08/2017", "22/06/2017", "22/07/2017", "22/08/2017",
                                                              "23/06/2017", "23/07/2017", "23/08/2017", "24/06/2017", "24/07/2017",
                                                              "24/08/2017", "25/06/2017", "25/07/2017", "25/08/2017", "26/06/2017",
                                                              "26/07/2017", "26/08/2017", "27/06/2017", "27/07/2017", "27/08/2017",
                                                              "28/06/2017", "28/07/2017", "28/08/2017", "29/06/2017", "29/07/2017",
                                                              "29/08/2017", "3/07/2017", "3/08/2017", "3/09/2017", "30/06/2017",
                                                              "30/07/2017", "30/08/2017", "31/07/2017", "31/08/2017", "4/07/2017",
                                                              "4/08/2017", "4/09/2017", "5/07/2017", "5/08/2017", "5/09/2017",
                                                              "6/08/2017", "6/09/2017", "7/08/2017", "7/09/2017", "8/08/2017",
                                                              "8/09/2017", "9/08/2017", "9/09/2017"), class = "factor")


response <- structure(c(4L, 2L, 3L, 7L, 2L, 7L, 5L, 3L, 1L, 1L, 3L, 4L, 2L,
                        3L, 4L, 5L, 6L, 1L, 3L, 4L, 1L, 7L, 2L, 1L, 4L, 1L, 1L, 2L, 5L,
                        1L, 1L, 1L, 6L, 1L, 1L, 3L, 2L, 2L, 1L, 6L, 1L, 1L, 2L, 5L, 1L,
                        1L, 4L, 1L, 1L, 1L, 7L, 1L, 1L, 1L, 6L), .Label = c("0", "1",
                                                                            "2", "3", "4", "5", "6"), class = "factor")


df <- data.frame(id, question_id, category_id, date, response)
我试过的
library(ggplot2)
library(tidyverse)

df %>%
  ggplot(aes(date,
             response,
             group = 1,
             colour = factor(df$question_id))) +
  geom_point() +
  geom_line() +
  facet_wrap(~ category_id, scale = "free_y", ncol = 2) +
  theme(axis.text.x = element_text(angle = 30, hjust = 1)) +
  labs(title = "Responses by Category",
       subtitle = "",
       color = "Question ID")
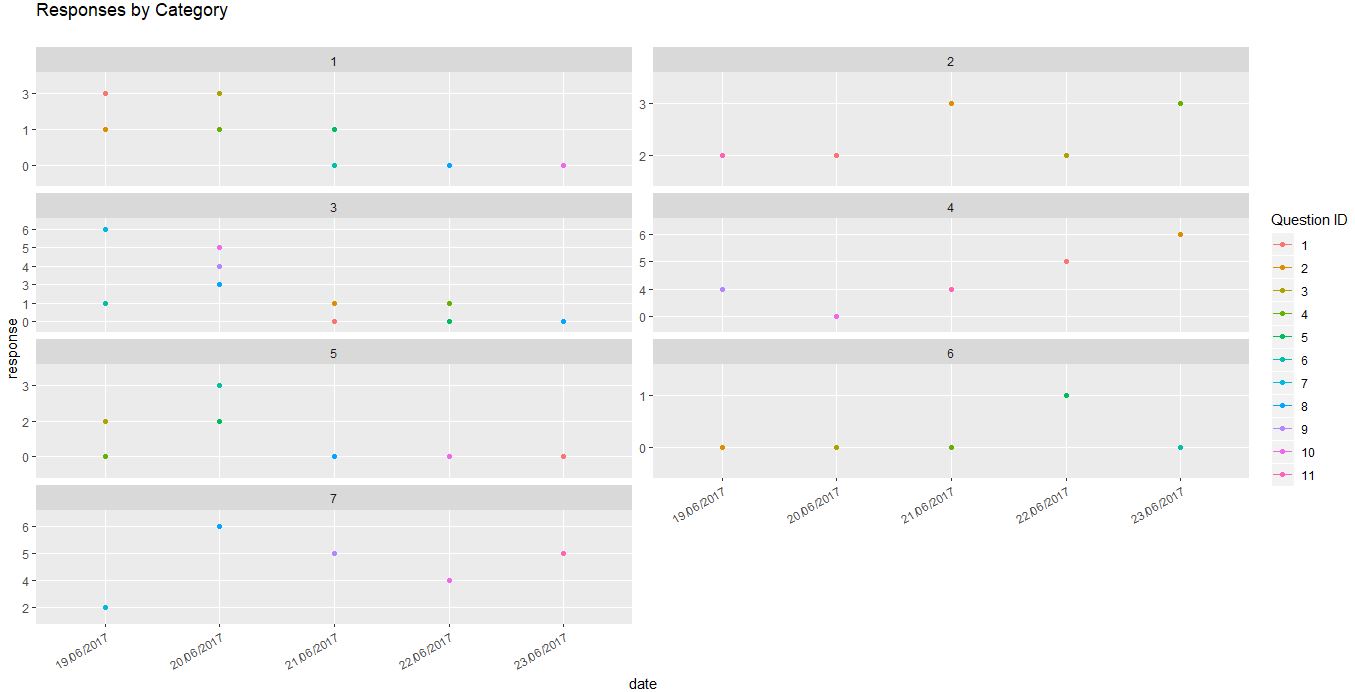
- 对于小面数3,例如在23号,响应重叠,只显示一个值。我想把每个question_id分成3部分
- 我想要颜色也显示question_id号码
谢谢:)
回答 1
Stack Overflow用户
回答已采纳
发布于 2018-10-05 06:37:29
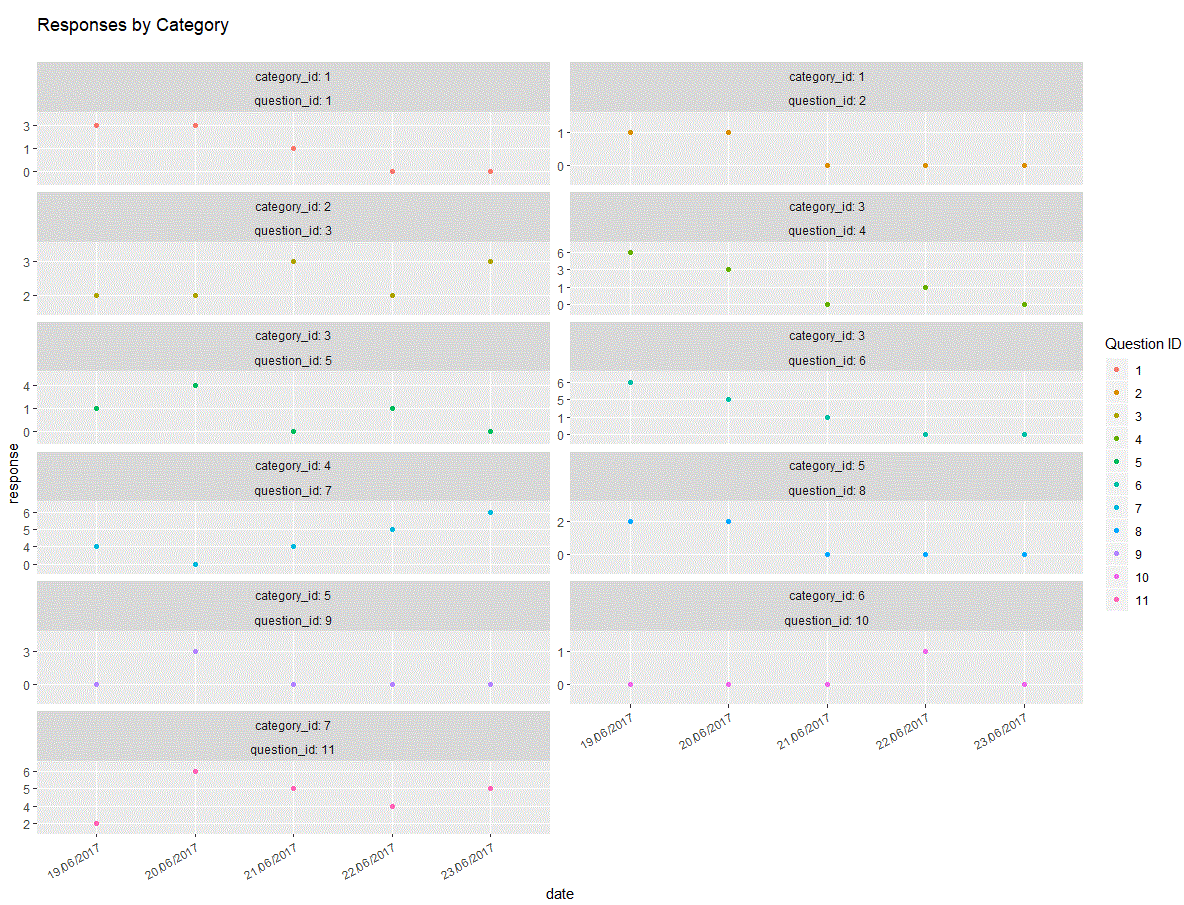
更新的应答(见以前版本的编辑)
df %>%
  ggplot(aes( x = date,
              y = response,
              color = question_id ) ) +
  geom_point() +
  facet_wrap( vars( category_id, question_id ),
              scale = "free_y",
              ncol = 2,
              labeller = label_both ) +
  theme( axis.text.x = element_text( angle = 30, hjust = 1 ) ) +
  labs(title = "Responses by Category",
       subtitle = "",
       color = "Question ID")
页面原文内容由Stack Overflow提供。腾讯云小微IT领域专用引擎提供翻译支持
原文链接:
https://stackoverflow.com/questions/52659464
复制相关文章
相似问题
腾讯云开发者

Copyright © 2013 - 2026 Tencent Cloud. All Rights Reserved. 腾讯云 版权所有
深圳市腾讯计算机系统有限公司 ICP备案/许可证号:粤B2-20090059 ![]() 粤公网安备44030502008569号
粤公网安备44030502008569号
腾讯云计算(北京)有限责任公司 京ICP证150476号 | 京ICP备11018762号