
X-蜱与地块中定义的桶不匹配。
X-蜱与地块中定义的桶不匹配。
提问于 2018-09-23 19:55:17
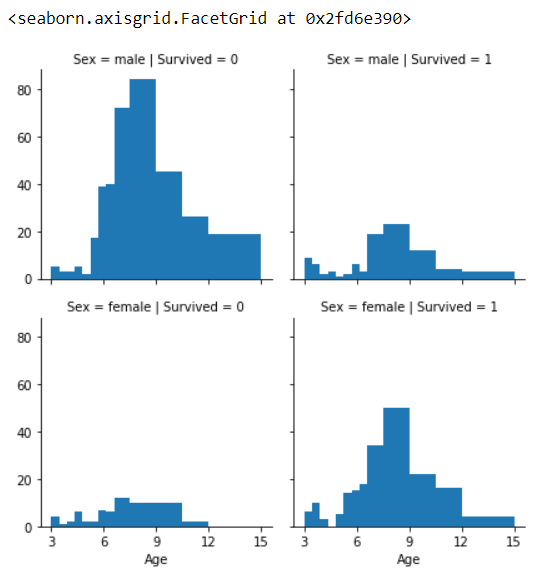
我使用Seaborn的FacetGrid绘制多个带有预定义回收箱的matplotlib.pyplot.hist图。我想要它显示X-勾标签。
根据我所读到的,我试着:
bins = [0,3,6,9,12,15,18,21,24,30,40,50,60,80]
g = sns.FacetGrid(allData, col="Survived", row="Sex")
g = g.map(plt.hist, "Age", bins=bins)
g.set_xticklabels(bins)
滴答不像我预期的那样与垃圾箱相匹配;我会认为每个条子都是一个“垃圾桶”,所以第一个栏是: 0-3,第二条: 3-6等等。相反,每个滴答都跨越多个条形。(正在使用泰坦尼克号数据集)。
我基本上希望每个标有年龄范围的酒吧都是代表的。我不知道我哪里出了问题,任何帮助都会很感激。
回答 2
Stack Overflow用户
回答已采纳
发布于 2018-09-24 06:58:22
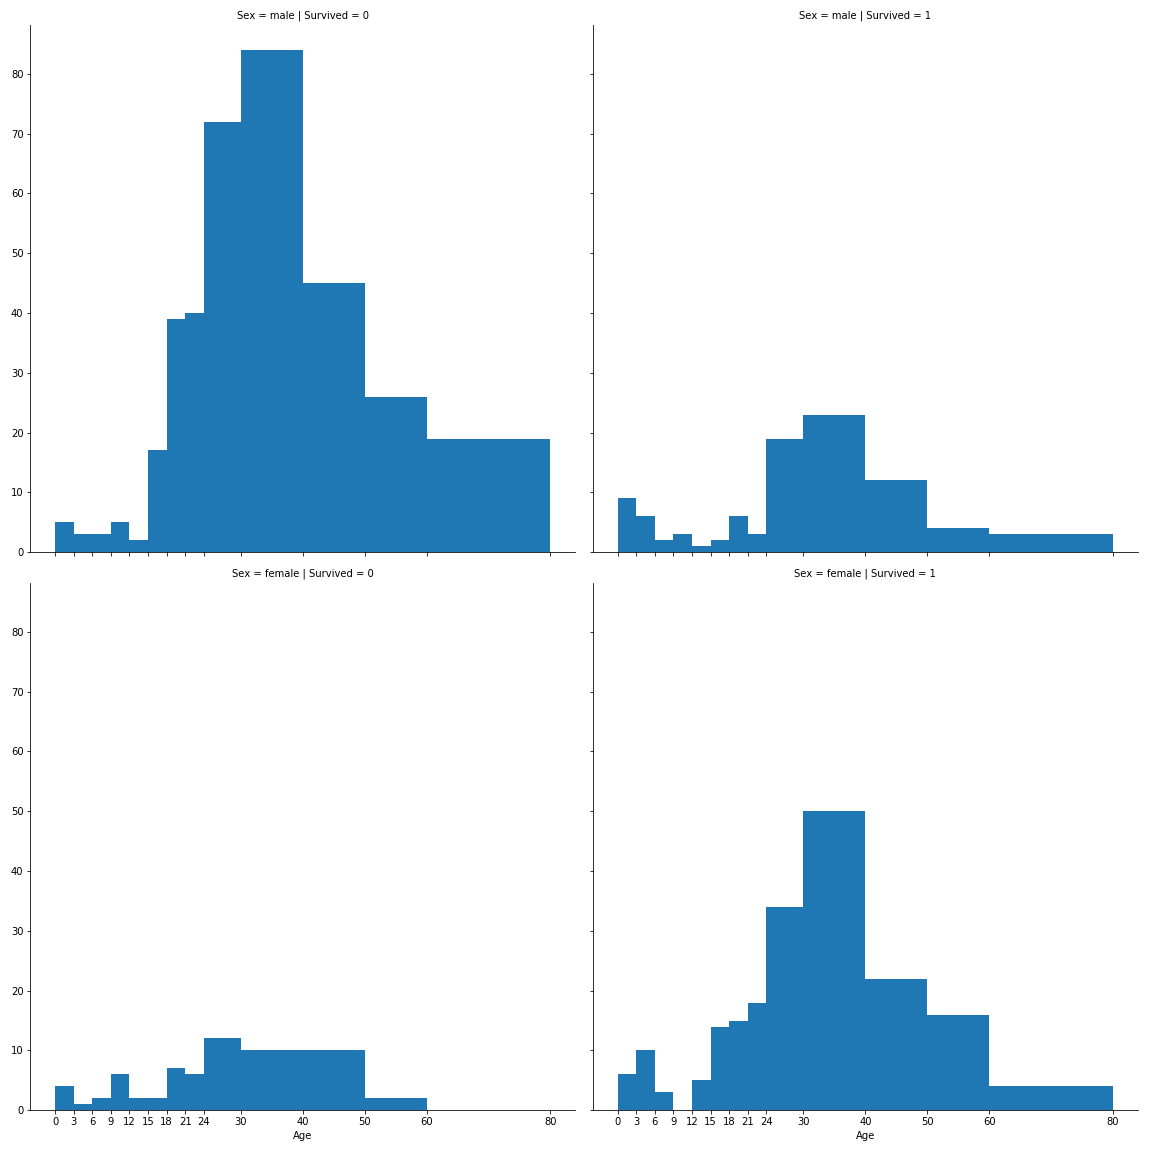
这里有一个例子(用.set(xticks=bins) )
bins = [0,3,6,9,12,15,18,21,24,30,40,50,60,80]
g = sns.FacetGrid(allData, col="Survived", row="Sex", size=8)
g = (g.map(plt.hist, "Age", bins=bins)).set(xticks=bins)
Stack Overflow用户
发布于 2018-09-23 21:08:54
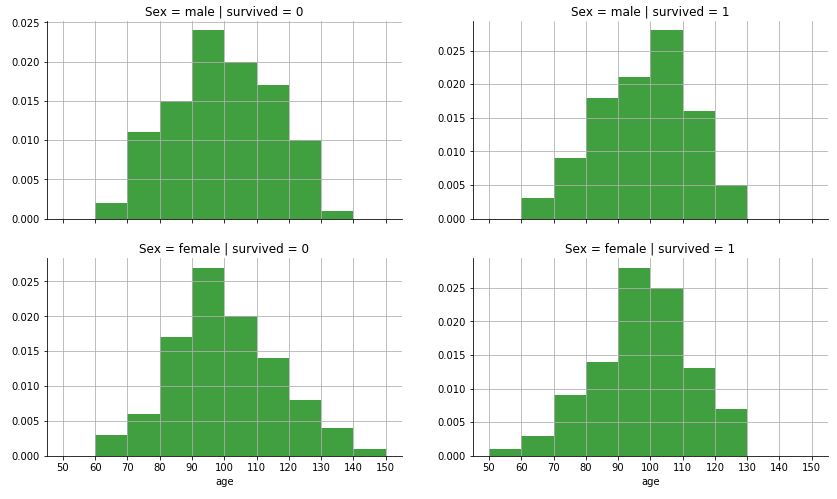
我从未使用过sns,在matplotlib中,我可以更好地控制绘图,尽管需要更多的输入。
import numpy as np
import matplotlib.pyplot as plt


def fun():
    mu, sigma = 100, 15
    x = mu + sigma * np.random.randn(100)
    return x


fig, ax = plt.subplots(2,2, sharex=True, figsize=(14, 8))

binned = list(range(50, 160, 10))

ax[0,0].hist(fun(), binned, density=True, facecolor='g', alpha=0.75)
ax[0,0].set_title('Sex = male | survived = 0')
ax[0,1].hist(fun(), binned, density=True, facecolor='g', alpha=0.75)
ax[0,1].set_title('Sex = male | survived = 1')
ax[1,0].hist(fun(), binned, density=True, facecolor='g', alpha=0.75)
ax[1,0].set_title('Sex = female | survived = 0')
ax[1,1].hist(fun(), binned, density=True, facecolor='g', alpha=0.75)
ax[1,1].set_title('Sex = female | survived = 1')


for col in ax:
    for row in col:
        if row.axes.rowNum == 1:
            row.set_xlabel('age')
        row.locator_params(axis='x', nbins=15)
        row.spines['right'].set_visible(False)
        row.spines['top'].set_visible(False)
        row.grid()
plt.show()
页面原文内容由Stack Overflow提供。腾讯云小微IT领域专用引擎提供翻译支持
原文链接:
https://stackoverflow.com/questions/52469735
复制相关文章
相似问题
腾讯云开发者

Copyright © 2013 - 2026 Tencent Cloud. All Rights Reserved. 腾讯云 版权所有
深圳市腾讯计算机系统有限公司 ICP备案/许可证号:粤B2-20090059 ![]() 粤公网安备44030502008569号
粤公网安备44030502008569号
腾讯云计算(北京)有限责任公司 京ICP证150476号 | 京ICP备11018762号