
有向图形为空白,但xts对象有一个观察。
问题的闪亮版本(最初的问题):
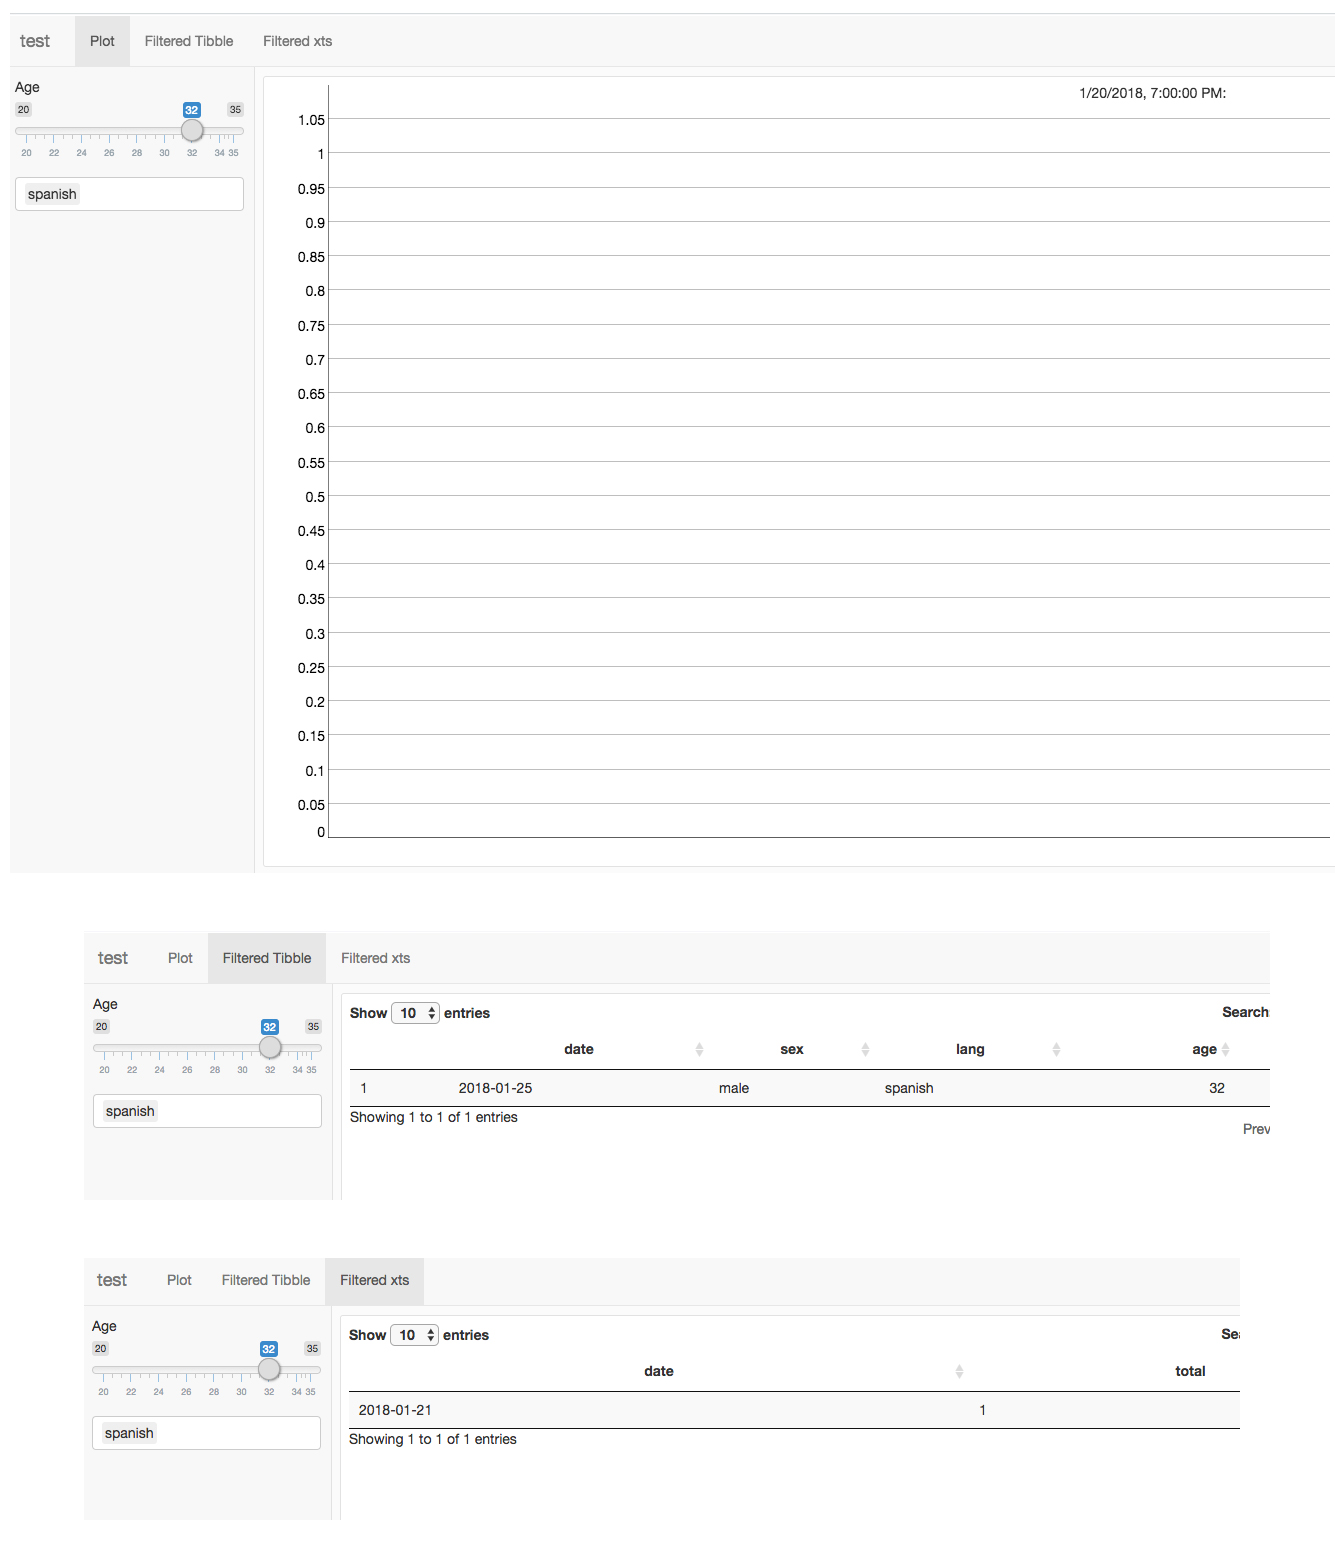
我正在绘制一个基于xts对象的有向图,该对象是基于两个输入的过滤结果:年龄和语言。
如果我将年龄滑块移动到32的下限和上限,并在输入框中输入“西班牙语”,则图是空的。但是,过滤后的tibble和已过滤的xts对象都显示了1个观察结果。这个观察结果应该出现在情节中,但没有出现。
我觉得我错过了一些非常基本的东西,但我不能把手指放在上面。
---
title: "test"
output:
  flexdashboard::flex_dashboard:
    theme: bootstrap
runtime: shiny
---

```{r setup, include=FALSE}
图书馆(柔性仪表板)
图书馆(Tidyverse)
图书馆(Tibbletime)
图书馆(有向图)
图书馆(Magrittr)
图书馆(Xts)
图书馆(DT)
```{r global, include=FALSE}生成数据
set.seed(1)
dat <- data.frame(date = seq(as.Date("2018-01-01") )
as.Date("2018-06-30"), "days"), sex = sample(c("male", "female"), 181, replace=TRUE), lang = sample(c("english", "spanish"), 181, replace=TRUE), age = sample(20:35, 181, replace=TRUE))dat <- sample_n(dat,80)
Sidebar {.sidebar}
=====================================

```{r}
sliderInput("agerange",标签=“年龄”,
min = 20, max = 35, value = c(20, 35), step=1)selectizeInput(
‘'foo',标签=空,
选项=c(“英语”、“西班牙语”、“其他”)、
multiple = TRUE
)
Plot
=====================================

```{r}
全
过滤<-反应性({
req((在%输入$foo中为dat$lang%)\is.null(输入$foo))
dat %>%
mutate(new = 1) %>%arrange(date) %>%filter(if(is.null(input$foo)) (new==1) else (lang %in% input$foo)) %>%filter(age >= input$agerange[1] & age <= input$agerange[2])})
总数<-反应性({
过滤<- filtered()
过滤%>%
时间序列分析
tibbletime::as_tbl_time(index = date) %>% #转换为tibble对象
select(date, new) %>%tibbletime::collapse_by("1 week", side = "start", clean = TRUE) %>%group_by(date) %>%mutate(total = sum(new, na.rm = TRUE)) %>%distinct(date, .keep_all = TRUE) %>%ungroup() %>%# expand matrix to include weeks without datacomplete( date = seq(date[1], date[length(date)], by = "1 week"), fill = list(total = 0))})
转换为xts
totals_ <-反应性({
totals <- totals()xts(totals, order.by = totals$date)})
绘图
renderDygraph({
总数<-总计()
有向图(totals_,“总计”) %>%
dyRangeSelector() %>%dyOptions(useDataTimezone = FALSE, stepPlot = TRUE, drawGrid = FALSE, fillGraph = TRUE) })
Filtered Tibble
=====================================

```{r}
DT::renderDataTable({
filtered <- filtered() DT::datatable(filtered, options = list(bPaginate = TRUE))})
Filtered xts
=====================================

```{r}
DT::renderDataTable({
totals_ <- totals_() DT::datatable(totals_[, c("date", "total")], options = list(bPaginate = TRUE))})
非闪亮版:
为了隔离这个问题,我将我的示例从闪亮(我的实际用例)中移出。
library(tidyverse)
library(tibbletime)
library(dygraphs)
library(magrittr)
library(xts)

set.seed(1)
dat <- data.frame(date = seq(as.Date("2018-01-01"),
                             as.Date("2018-06-30"),
                             "days"),
                  sex = sample(c("male", "female"), 181, replace=TRUE),
                  lang = sample(c("english", "spanish"), 181, replace=TRUE),
                  age = sample(20:35, 181, replace=TRUE))
dat <- sample_n(dat, 80)

totals <-
dat %>%
  mutate(new = 1) %>%
  arrange(date) %>%
  filter(lang=="spanish") %>%
  filter(age>=32 & age<=32) %>%
  {. ->> filtered} %>%
  tibbletime::as_tbl_time(index = date) %>% # convert to tibble time object
  select(date, new) %>%
  tibbletime::collapse_by("1 week", side = "start", clean = TRUE) %>%
  group_by(date) %>%
  mutate(total = sum(new, na.rm = TRUE)) %>%
  distinct(date, .keep_all = TRUE) %>%
  ungroup() %>%
  # expand matrix to include weeks without data
  complete(
    date = seq(date[1], date[length(date)], by = "1 week"),
    fill = list(total = 0))

filtered

#        date  sex    lang age new
#1 2018-01-25 male spanish  32   1

# convert to xts
totals_ <- xts(totals, order.by = totals$date)

totals_

#           date         new total
#2018-01-21 "2018-01-21" "1" "1"

# plot
dygraph(totals_[, "total"]) %>%
  dyRangeSelector() %>%
  dyOptions(useDataTimezone = FALSE,
            stepPlot = TRUE,
            drawGrid = FALSE,
fillGraph = TRUE)回答 1
Stack Overflow用户
发布于 2018-09-13 21:00:33
我认为最基本的问题是,有向图形不会绘制由1行组成的xts对象。因此,每当通过闪亮的输入设置过滤器(或静态筛选器调用)将数据集减少到1匹配( xts对象中的1行)时,图将为空。
(如果匹配为零,则R在tibbletime步骤的示例中抛出一个错误,因为没有行。)
https://stackoverflow.com/questions/52321011
复制相似问题
腾讯云开发者

Copyright © 2013 - 2026 Tencent Cloud. All Rights Reserved. 腾讯云 版权所有
深圳市腾讯计算机系统有限公司 ICP备案/许可证号:粤B2-20090059 ![]() 粤公网安备44030502008569号
粤公网安备44030502008569号
腾讯云计算(北京)有限责任公司 京ICP证150476号 | 京ICP备11018762号