
用stat_function更改绘制线的大小
用stat_function更改绘制线的大小
提问于 2018-09-10 21:35:28
我试图在R上用stat_function在ggplot2中绘制一系列函数,这个函数在整个过程中保持不变,但是一些参数会根据数据帧中的值而变化。我使用一个for循环来绘制函数的每一种不同形式。
我想使用不同的大小绘制线条,但无论我如何更改aes参数,stat_function绘制的线条的大小都保持不变。我可以改变情节中其他行的大小。
密码
 test_fun <- function(x,d,fstart,fend,h){
  mp=mean(c(fstart, fend))
  a=h/((mp-fstart)*(mp-fend))
  a*(x-fstart)*(x-fend)
}
plot <- ggplot() + xlim(min(gtf.tx$start), max(gtf.tx$end))+ ylim(-pheight/2,pheight/2)
for(i in 1:nrow(rmats_to_plot)){
  weight=rmats_to_plot[i,5]*100
  start=rmats_to_plot[i,1]
  end=rmats_to_plot[i,2]
  flip=rmats_to_plot[i,6]
  height=rmats_to_plot[i,8]
  plot <- plot+stat_function(mapping = aes(size=1),xlim = c(start,end),fun = test_fun,args = list(fstart=start,fend=end, d=flip,h=height))

}
plot <- plot +  geom_hline(yintercept = 0,size=7,color='white')+
  geom_hline(yintercept=0,alpha=.9, size=1)+geom_segment(data = gtf.tx,aes(x=start,xend=end,y=0, yend=0),size=7)+theme_minimal()
和数据
start   end sample_1    sample_2    total_weight    flip    size    height
31.98   32.71   20.5    39  0.1662  -1  0.73    20
33.36   49.86   16.5    27.5    0.1229  -1  16.5    40
12.13   29.21   20.5    39  0.1662  -1  17.08   60
12.13   32.71   28.5    34  0.1746  1   20.58   -20
51.17   79.79   16.5    40  0.1578  1   28.62   -40
12.13   49.86   21.5    46  0.1885  1   37.73   -60
33.36   79.79   4   2.5 0.0182  -1  46.43   80
12.13   79.79   0   2   0.0056  1   67.66   -80
如能提供任何帮助,将不胜感激。
回答 1
Stack Overflow用户
回答已采纳
发布于 2018-09-10 22:52:45
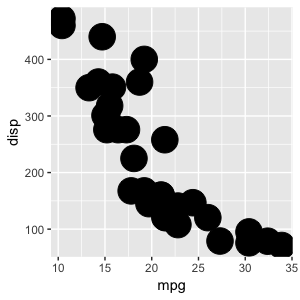
因为您希望size是一个特定的值,所以应该将它放在aes之外。
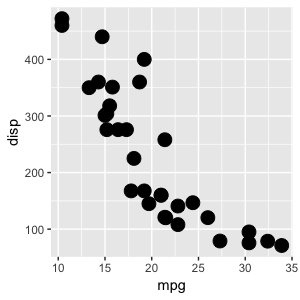
通过将size=1放入aes中,您将设置一个需要用scale_size_*函数定义的标度。就像你把size='dog'
ggplot(mtcars) + geom_point(aes(x=mpg, y=disp, size = 1))

ggplot(mtcars) + geom_point(aes(x=mpg, y=disp, size = 9))
ggplot(mtcars) + geom_point(aes(x=mpg, y=disp), size = 9)
页面原文内容由Stack Overflow提供。腾讯云小微IT领域专用引擎提供翻译支持
原文链接:
https://stackoverflow.com/questions/52265807
复制相关文章
相似问题
腾讯云开发者

Copyright © 2013 - 2026 Tencent Cloud. All Rights Reserved. 腾讯云 版权所有
深圳市腾讯计算机系统有限公司 ICP备案/许可证号:粤B2-20090059 ![]() 粤公网安备44030502008569号
粤公网安备44030502008569号
腾讯云计算(北京)有限责任公司 京ICP证150476号 | 京ICP备11018762号