
获取ECDF的导数
获取ECDF的导数
提问于 2018-07-20 08:47:37
有可能区分ECDF吗?例如,以下面获得的结果为例。
set.seed(1)

a <- sort(rnorm(100))
b <- ecdf(a)

plot(b)
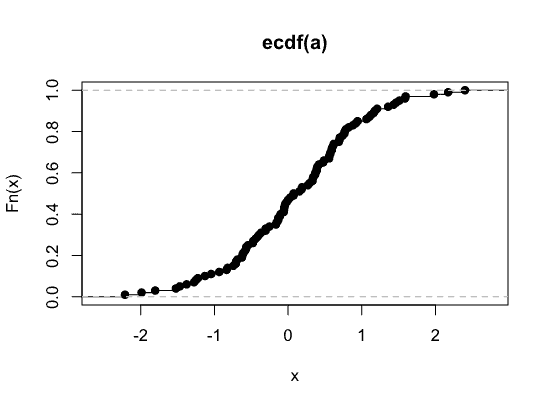
为了得到它的概率密度函数,我想取b的导数。
回答 1
Stack Overflow用户
发布于 2018-07-20 08:50:56
n <- length(a)  ## `a` must be sorted in non-decreasing order already
plot(a, 1:n / n, type = "s")  ## "staircase" plot; not "line" plot
不过,我想找出
b的导数
在基于样本的统计中,由于样本的大小是有限的,并且由于样本的大小是有限的,并且ECDF是不可微的,所以估计的密度(对于连续的随机变量)并不是通过微分从ECDF中得到的。相反,我们直接估计密度。我想plot(density(a))才是你真正想要的。
几天后.
警告:以下只是一个没有统计依据的数值解!
我把它作为一个练习来学习关于形状约束加性模型的R包scam,这是伍德教授早期PhD学生Pya博士的一个mgcv儿童软件包。
逻辑是这样的:
- 使用
scam::scam,将单调增长的P样条拟合到ECDF (您必须指定需要多少节);[注意,单调性不是唯一的理论约束。要求平滑的ECDF在其两条边上“剪裁”:左边在0处,右边在1处。我目前正在使用weights来施加这样的约束,方法是在两条边赋予很大的权重]。 - 利用
stats::splinefun,用单调插值样条重新参数化拟合样条,通过节数和节处预测值; - 返回插值样条函数,该函数也能求出第一、第二和第三导数。
--为什么我希望它能起作用:
随着样本数量的增加,
- ECDF收敛到CDF;
- P样条是一致的,因此光滑的ECDF将越来越无偏;
- 平滑的ECDF的一阶导数对于PDF来说将越来越无偏。
谨慎使用:
- 你必须自己选择结的数目;
- 导数为,未进行归一化,曲线下面积为1;
- 结果可能相当不稳定,而且只对大样本量有利。
函数参数:
x:一个样本向量;n.knots:结数;n.cells:绘制导数函数时的网格点数
您需要从CRAN安装scam包。
library(scam)
test <- function (x, n.knots, n.cells) {
## get ECDF
n <- length(x)
x <- sort(x)
y <- 1:n / n
dat <- data.frame(x = x, y = y) ## make sure `scam` can find `x` and `y`
## fit a monotonically increasing P-spline for ECDF
fit <- scam::scam(y ~ s(x, bs = "mpi", k = n.knots), data = dat,
weights = c(n, rep(1, n - 2), 10 * n))
## interior knots
xk <- with(fit$smooth[[1]], knots[4:(length(knots) - 3)])
## spline values at interior knots
yk <- predict(fit, newdata = data.frame(x = xk))
## reparametrization into a monotone interpolation spline
f <- stats::splinefun(xk, yk, "hyman")
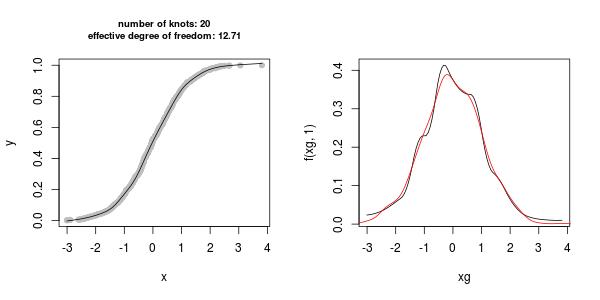
par(mfrow = c(1, 2))
plot(x, y, pch = 19, col = "gray") ## ECDF
lines(x, f(x), type = "l") ## smoothed ECDF
title(paste0("number of knots: ", n.knots,
"\neffective degree of freedom: ", round(sum(fit$edf), 2)),
cex.main = 0.8)
xg <- seq(min(x), max(x), length = n.cells)
plot(xg, f(xg, 1), type = "l") ## density estimated by scam
lines(stats::density(x), col = 2) ## a proper density estimate by density
## return smooth ECDF function
f
}## try large sample size
set.seed(1)
x <- rnorm(1000)
f <- test(x, n.knots = 20, n.cells = 100)
f是由stats::splinefun (read ?splinefun)返回的函数。
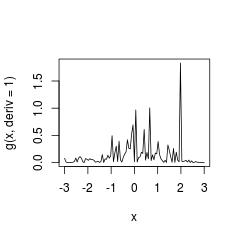
一种朴素的,类似的解决办法是在不平滑的情况下在ECDF上进行插值样条。但这是一个非常糟糕的想法,因为我们没有一致性。
g <- splinefun(sort(x), 1:length(x) / length(x), method = "hyman")
curve(g(x, deriv = 1), from = -3, to = 3)
stats::density提醒:强烈建议使用进行直接密度估计。
页面原文内容由Stack Overflow提供。腾讯云小微IT领域专用引擎提供翻译支持
原文链接:
https://stackoverflow.com/questions/51438627
复制相关文章
相似问题
腾讯云开发者

Copyright © 2013 - 2026 Tencent Cloud. All Rights Reserved. 腾讯云 版权所有
深圳市腾讯计算机系统有限公司 ICP备案/许可证号:粤B2-20090059 ![]() 粤公网安备44030502008569号
粤公网安备44030502008569号
腾讯云计算(北京)有限责任公司 京ICP证150476号 | 京ICP备11018762号