
动态渲染盒
动态渲染盒
提问于 2018-07-17 07:25:44
如何根据数据呈现一个发亮的盒子。数据是由用户上传的,它可以有更多的数据,所以我必须动态地创建一个框。我正在运行下面的代码,我将在控制台中创建四个盒子,而不是在闪亮的网页中创建。请看一看,谢谢。
代码
   list_data <- list(c("AB","CD","EF","GH"))  #data

ui <- dashboardPage(
      dashboardHeader(title = "Text Mining"),
        dashboardSidebar(
         sidebarMenu(
          menuItem("NLP Tree", tabName = "NLP")
         )
       ),

      dashboardBody(
       tabItems(
        tabItem(tabName = "NLP",
         fluidRow(
          tabBox(width = 12,height="500",
           tabPanel("Sentences",
            uiOutput("nlp_sentences_tree")
                   )
            )
           )
          )
         )
        )
       )


server <- function(input, output) {

  output$nlp_sentences_tree <- renderUI({

    for(i in list_data[[1]]){
     print(box(width = 8,
            i
           )
         )
        }
     })
    }

shinyApp(ui = ui, server = server)回答 2
Stack Overflow用户
回答已采纳
发布于 2018-07-17 07:33:01
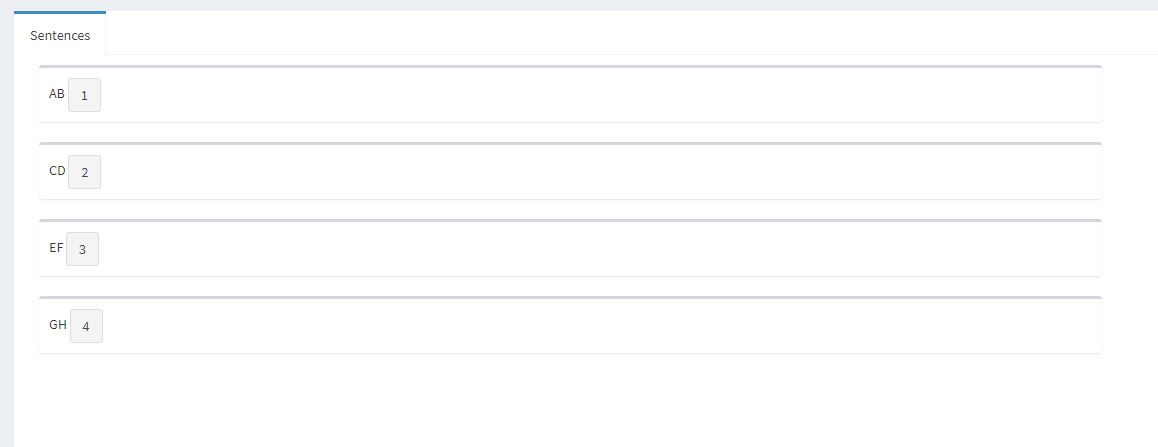
看看这里,我给每个都加了一个按钮,这样里面就有东西了
library(shinydashboard)
library(shiny)

list_data <- list(c("AB","CD","EF","GH"))  #data

ui <- dashboardPage(
  dashboardHeader(title = "Text Mining"),
  dashboardSidebar(
    sidebarMenu(
      menuItem("NLP Tree", tabName = "NLP")
    )
  ),

  dashboardBody(
    tabItems(
      tabItem(tabName = "NLP",
              fluidRow(
                tabBox(width = 12,height="500",
                       tabPanel("Sentences",
                                uiOutput("nlp_sentences_tree")
                       )
                )
              )
      )
    )
  )
)


server <- function(input, output) {

  v <- list()
  for (i in 1:length(list_data[[1]])){
    v[[i]] <- box(width = 8, list_data[[1]][i],actionButton(i,i))
  }
  output$nlp_sentences_tree <- renderUI(v)
}

shinyApp(ui = ui, server = server)
Stack Overflow用户
发布于 2018-07-17 07:36:31
或者使用lapply和tagList
server <- function(input, output) {
  output$nlp_sentences_tree <- renderUI({
    a <- lapply(list_data[[1]], function(x) {
      box(width = 8, x)
    })
    tagList(a)
  })
}页面原文内容由Stack Overflow提供。腾讯云小微IT领域专用引擎提供翻译支持
原文链接:
https://stackoverflow.com/questions/51375520
复制相关文章
相似问题
腾讯云开发者

Copyright © 2013 - 2026 Tencent Cloud. All Rights Reserved. 腾讯云 版权所有
深圳市腾讯计算机系统有限公司 ICP备案/许可证号:粤B2-20090059 ![]() 粤公网安备44030502008569号
粤公网安备44030502008569号
腾讯云计算(北京)有限责任公司 京ICP证150476号 | 京ICP备11018762号