
来自sqlite表的qt c++绘图自定义图
来自sqlite表的qt c++绘图自定义图
提问于 2018-07-16 07:23:13
我是Qt创建者C++的新手。我设计了一个应用程序,在这个应用程序中,数据显示在从Sqlite数据库中获取的tableView上,直到这里我才成功,但现在我想通过从我获取的数据库中绘制x和y轴的值,并在tableView widget.Example上显示它来绘制自定义图:我的数据库中的数据就像时间和温度一样--现在我想给出X轴的时间值和Y轴的温度值,请在代码中帮助我--我能够绘制通常如下面代码所示的图形,如何在x轴和y轴上添加数据库值。
void MainWindow::makePlot()
{
    QVector<double> x(100), y(101);

//    x[0]=1;Here I want the application to take the values from tableView,like
              Time on X axis and Temp on Y axis.
//    x[1]=2;
//    x[2]=3;
//    x[3]=4;

//    y[0]=1;
//    y[1]=2;
//    y[2]=3;
//    y[3]=4;

    ui->customPlot->addGraph();
    ui->customPlot->graph(0)->setData(x, y);
    ui->customPlot->xAxis->setLabel("Time");
    ui->customPlot->yAxis->setLabel("Temp");
    ui->customPlot->xAxis->setRange(1, 15);
    ui->customPlot->yAxis->setRange(1, 15);
    ui->customPlot->replot();

}

Here is the code that displays the Database in tableView on push button.
void MainWindow::on_pushButton_clicked()
{
    MainWindow conn;
    QSqlQueryModel * modal=new QSqlQueryModel();
    conn.connOpen();
    QSqlQuery* qry=new QSqlQuery(conn.mydb);
    qry->prepare("select * from empdata");
    qry->exec();
    modal->setQuery(*qry);
    ui->tableView->setModel(modal);
    conn.connClose();
    qDebug() <<(modal->rowCount());
}[![enter image description here][1]][1]
请提前帮我out..Thanks。
回答 1
Stack Overflow用户
发布于 2018-07-16 09:30:33
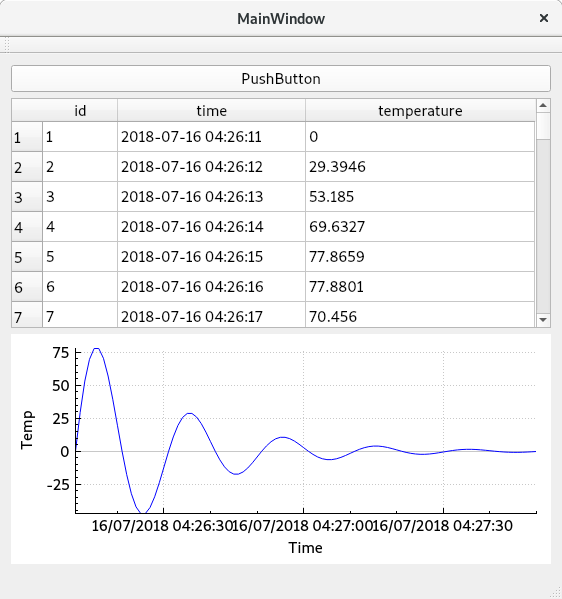
在这个解决方案中,我假设表是以以下方式创建的(使用sqlite作为数据库):
create table empdata (id INTEGER PRIMARY KEY AUTOINCREMENT,
                      time DATETIME,
                      temperature REAL)
我还将使用QSqlTableModel作为模型,如果您想使用QSqlQueryModel,则逻辑类似。
QSqlTableModel *model=new QSqlTableModel;
model->setTable("empdata");
model->select();
ui->tableView->setModel(model);

ui->customPlot->xAxis->setLabel("Time");
ui->customPlot->yAxis->setLabel("Temp");
QSharedPointer<QCPAxisTickerDateTime> dateTicker(new QCPAxisTickerDateTime);
dateTicker->setDateTimeFormat("dd/MM/yyyy hh:mm:ss");
ui->customPlot->xAxis->setTicker(dateTicker);

QVector<QCPGraphData> timeData(model->rowCount());

for(int i=0; i< model->rowCount(); ++i){
    timeData[i].key = model->index(i, model->fieldIndex("time")).data().toDateTime().toTime_t();
    timeData[i].value = model->index(i, model->fieldIndex("temperature")).data().toDouble();
}

double Tmin = (*std::min_element(timeData.begin(), timeData.end(),
                                [](const QCPGraphData& x, const QCPGraphData& y)
{  return x.key < y.key; })).key;
double Tmax = (*std::max_element(timeData.begin(), timeData.end(),
                                [](const QCPGraphData& x, const QCPGraphData& y)
{  return x.key < y.key; })).key;

double Ymin = (*std::min_element(timeData.begin(), timeData.end(),
                                [](const QCPGraphData& x, const QCPGraphData& y)
{  return x.value < y.value; })).value;

double Ymax = (*std::max_element(timeData.begin(), timeData.end(),
                                [](const QCPGraphData& x, const QCPGraphData& y)
{  return x.value < y.value; })).value;

ui->customPlot->xAxis->setRange(Tmin, Tmax);
ui->customPlot->yAxis->setRange(Ymin, Ymax);
ui->customPlot->graph(0)->data()->set(timeData);
ui->customPlot->replot();
在下面的链接中是完整的示例。
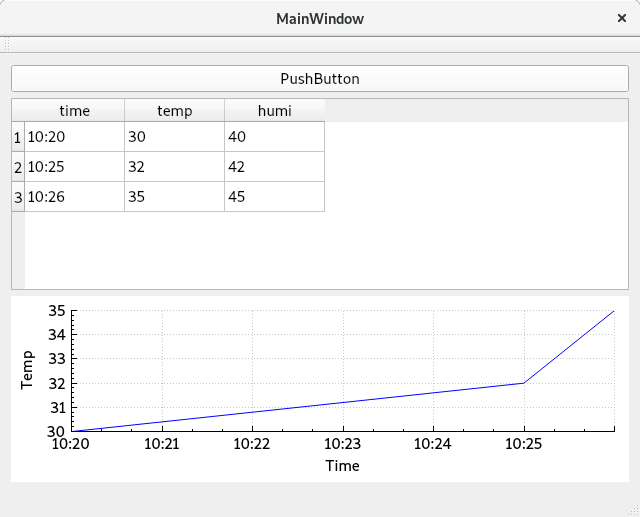
更新:
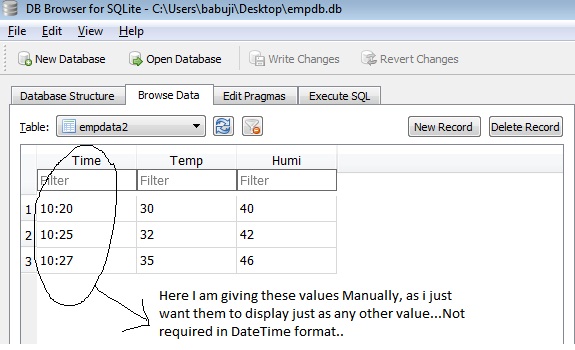
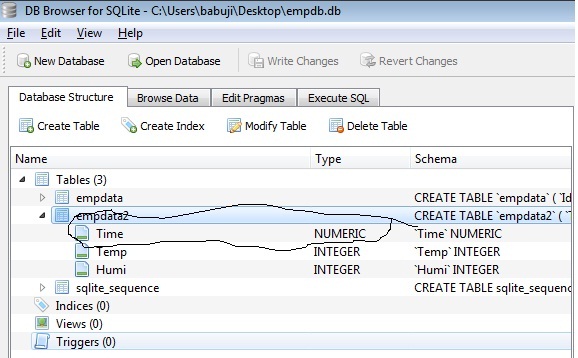
解决方案类似,但您必须将该QString转换为QDateTime
QSqlTableModel *model=new QSqlTableModel;
model->setTable("empdata2");
model->select();
ui->tableView->setModel(model);

ui->customPlot->xAxis->setLabel("Time");
ui->customPlot->yAxis->setLabel("Temp");
QSharedPointer<QCPAxisTickerDateTime> dateTicker(new QCPAxisTickerDateTime);
dateTicker->setDateTimeFormat("hh:mm");
ui->customPlot->xAxis->setTicker(dateTicker);

QVector<QCPGraphData> timeData(model->rowCount());

for(int i=0; i< model->rowCount(); ++i){
    timeData[i].key = QDateTime(QDate::currentDate(), model->index(i, model->fieldIndex("time")).data().toTime()).toTime_t();
    timeData[i].value = model->index(i, model->fieldIndex("temp")).data().toDouble();
}

double Tmin = (*std::min_element(timeData.begin(), timeData.end(),
                                [](const QCPGraphData& x, const QCPGraphData& y)
{  return x.key < y.key; })).key;
double Tmax = (*std::max_element(timeData.begin(), timeData.end(),
                                [](const QCPGraphData& x, const QCPGraphData& y)
{  return x.key < y.key; })).key;

double Ymin = (*std::min_element(timeData.begin(), timeData.end(),
                                [](const QCPGraphData& x, const QCPGraphData& y)
{  return x.value < y.value; })).value;

double Ymax = (*std::max_element(timeData.begin(), timeData.end(),
                                [](const QCPGraphData& x, const QCPGraphData& y)
{  return x.value < y.value; })).value;

ui->customPlot->xAxis->setRange(Tmin, Tmax);
ui->customPlot->yAxis->setRange(Ymin, Ymax);
ui->customPlot->graph(0)->data()->set(timeData);
ui->customPlot->replot();
您可以在以下链接中找到新的解决方案
页面原文内容由Stack Overflow提供。腾讯云小微IT领域专用引擎提供翻译支持
原文链接:
https://stackoverflow.com/questions/51356559
复制相关文章
相似问题
腾讯云开发者

Copyright © 2013 - 2026 Tencent Cloud. All Rights Reserved. 腾讯云 版权所有
深圳市腾讯计算机系统有限公司 ICP备案/许可证号:粤B2-20090059 ![]() 粤公网安备44030502008569号
粤公网安备44030502008569号
腾讯云计算(北京)有限责任公司 京ICP证150476号 | 京ICP备11018762号