
使用Python或graphviz的鱼骨图
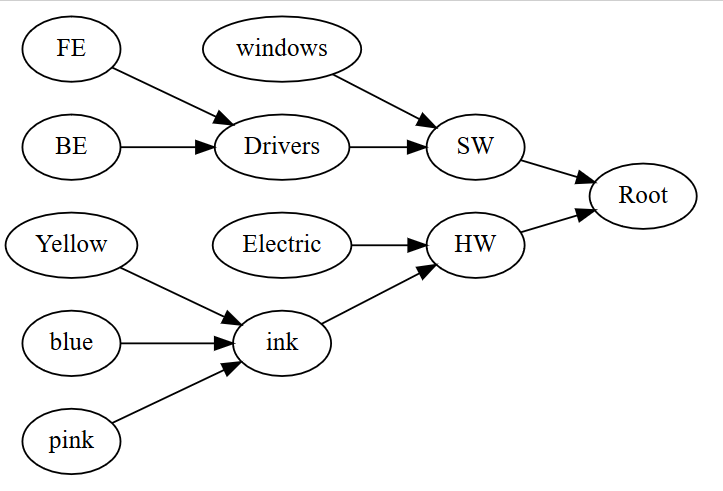
我试图用Python生成鱼骨图(因果图或石川图)。有没有办法让它更像标准鱼骨图?
from graphviz import Digraph

A=[('HW', 'Root'), ('SW', 'Root'),
  ('Electric', 'HW'), ('ink', 'HW'), ('windows', 'SW'), ('Drivers', 'SW'),
  ('Yellow', 'ink'), ('blue', 'ink'), ('pink', 'ink'),
  ('FE', 'Drivers'), ('BE', 'Drivers')]
e = Digraph()
e.attr(rankdir='LR')
for a in A:
    e.node(a[0])
    e.edge(a[0], a[1])
e.view()

回答 2
Stack Overflow用户
发布于 2022-05-09 19:31:16
用graphviz做这样的事情真的很困难,因为graphviz对于如何安排事情确实有自己的想法。你考虑过用matplotlib来解决这个问题吗?matplotlib中有一个创建时间线的示例,您可以使用它作为基础,并根据需要进行修改。
Stack Overflow用户
发布于 2022-05-11 17:51:42
如上所述,Fishbone图超出了Graphviz的规范。下面是示例图的“相当不错”(旁观者的眼睛)版本。如果您发现它可用,我将附加输入文件&解释发生了什么。如果无法使用,请解释您需要什么。
问题:
- 线路交叉口很马虎
- 结果需要三个步骤
dot -Tdot运行- 使用GVPR (一个Graphviz程序)进行后处理以创建wishbone "rake“
- 创建可视文件的
neato -n运行
- 这不处理输入文件的次/三级关系(断骨):
// non-directed graph, though directed would also work
graph W {
// no splines
graph [splines=line]
// use underline-shape
node [shape=underline]
// first, we define the nodes & edges that make the centerline edge
// note using standard ranking (top-to-bottom)
// centerline is set on one rank
// added a centerline attribute to make adding rak easier
// dot ignores unknown attributes
// gvpr program will use
{
rank=same
node [shape=rect style=invis centerline=true] // mark centerline
edge [headclip=false tailclip=false]
p1 [group=g1]
p2 [group=g2]
p3 [group=g3]
pstart:c -- p1:c -- p2:c -- p3:c
pend [label=" Defect XXX" shape=plain style=solid]
p3:c -- pend:w [dir=forward arrowhead=normal]
}
// define labels on top (min) rank
// plain, not underlined
{
rank=min
node [shape=plain]
measurements materials personnel
}
// define leftmost "fishbone"
// group attribte helps keep nodes aligned vertically
{
node [group=g1]
measurements:se -- calibration:e -- microscopes:e -- inspectors:e
// send this edge to the middle of the centerlin point
inspectors:e -- p1:c [headclip=false]
}
// define next "fishbone" to right
{
node [group=g2]
materials:s--alloys:e--Lubricants:e--Suppliers:e
Suppliers:e -- p2:c [headclip=false]
}
// define rightmost "fishbone"
{
node [group=g3]
personnel:s--shifts:e--training:e--operators:e--"another thing":e -- p3:c [headclip=false]
}
////////////////////////////////////////////////////////////////
// from here on, we are drawing edges out from centerline
////////////////////////////////////////////////////////////////
// define labels on bottom (max) rank
{
rank=max
node [shape=plaintext]
Environment Methods Machines
}
{
node [group=g1]
p1 -- Humidity:e [tailclip=false]
Humidity:e -- temperature:e -- Environment:n
}
{
node [group=g2]
p2 -- Angle:e [tailclip=false]
Angle:e --Engager:e-- Brake:e-- Methods:n
}
{
node [group=g3]
p3 -- "blade wear":e [tailclip=false]
"blade wear":e -- speed:e -- Machines:n
}
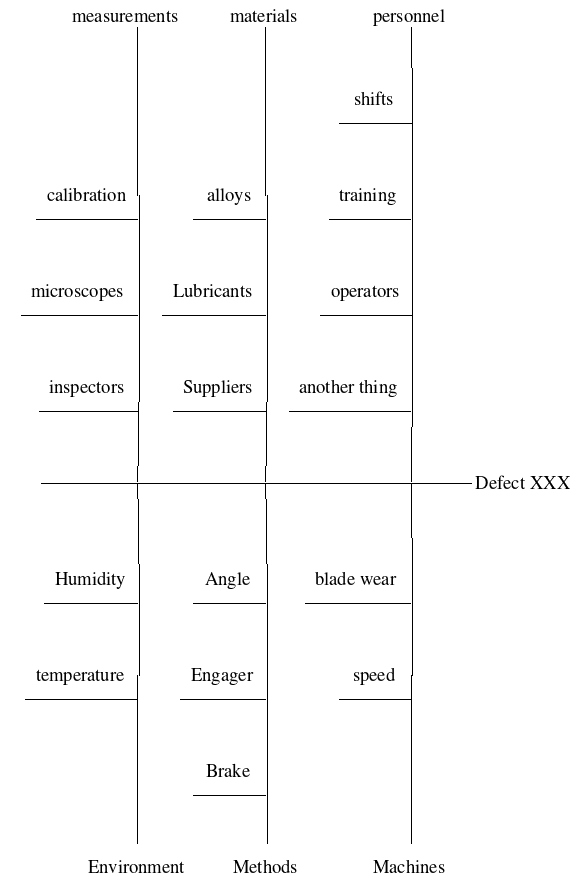
}运行上面的贯穿点,你会得到这个-不远,但不是鱼骨图:
现在,wishbone.gvpr --添加鱼骨耙的gvpr (https://www.graphviz.org/pdf/gvpr.1.pdf)程序:
BEGIN{
  int nIndx=0;
  float centerY=-999.9, dY, angleAdj, minY=9999, maxY=-9999;
  node_t Node[];
  graph_t theRoot, subG;
  void doErrs(string eString){
     printf(2, "Error:: %s\n", eString);
     print("// Error:: %s\n", eString); // temporary, for debugging
  }
}
///////////////////////////////////////////////////////////////////////////
N{
   Node[++nIndx]=$;
   if ((hasAttr($, "centerline")) && ($.centerline!="")){
      centerY=$.Y;
   }
   if ($.Y >maxY)
     maxY=$.Y;
   if ($.Y < minY)
     minY=$.Y;
}
////////////////////////////////////////////////////////////////////////////
END_G{
  if (centerY==-999.9){
      estr="\"centerline\" attribute is missing"; doErrs(estr);;
      exit(9);
  }
  $G.bb="";
  for (Node[nIndx]){
    print("//  pos before: ",Node[nIndx].pos);
    dY=Node[nIndx].Y-centerY;
    print("//  dY (1) : ", dY);
    // get absolute value
    if (dY<0){
      dY=-dY;
    }
    print("//  dY (2) : ", dY);
    Node[nIndx].pos=(string)(Node[nIndx].X - .25*dY) + "," + (string)Node[nIndx].Y;
    print("//  pos after: ", Node[nIndx].pos);
  }
}gvpr程序调整X坐标
然后neato -n (https://graphviz.org/faq/#FaqDotWithNodeCoords)修复边缘。
最后,执行所有操作的命令行(Linux) -(如果Windows不支持管道,只需将中间输出发送到临时文件)
dot -Tdot myfile.gv |
gvpr -c -f wishbone.gvpr  |
neato -n -Tpng >myfile.png
给予:
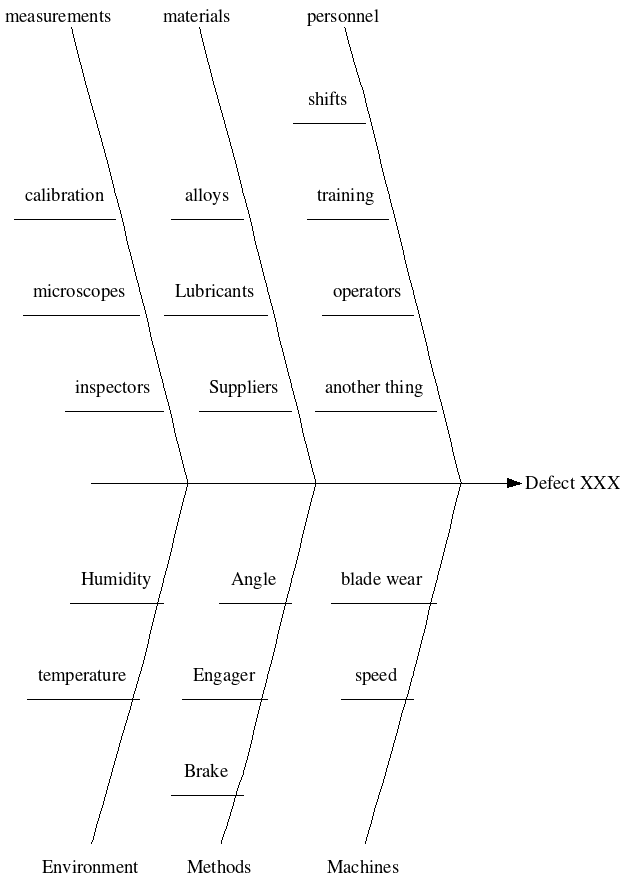
呼!
https://stackoverflow.com/questions/51348536
复制相似问题
腾讯云开发者

Copyright © 2013 - 2026 Tencent Cloud. All Rights Reserved. 腾讯云 版权所有
深圳市腾讯计算机系统有限公司 ICP备案/许可证号:粤B2-20090059 ![]() 粤公网安备44030502008569号
粤公网安备44030502008569号
腾讯云计算(北京)有限责任公司 京ICP证150476号 | 京ICP备11018762号