
如何在matplotlib框图中更改晶须帽的长度
如何在matplotlib框图中更改晶须帽的长度
提问于 2018-06-22 22:39:50
我试图更改框状晶须的帽长(最小值和最大值),在下面的图片中标记为红色。
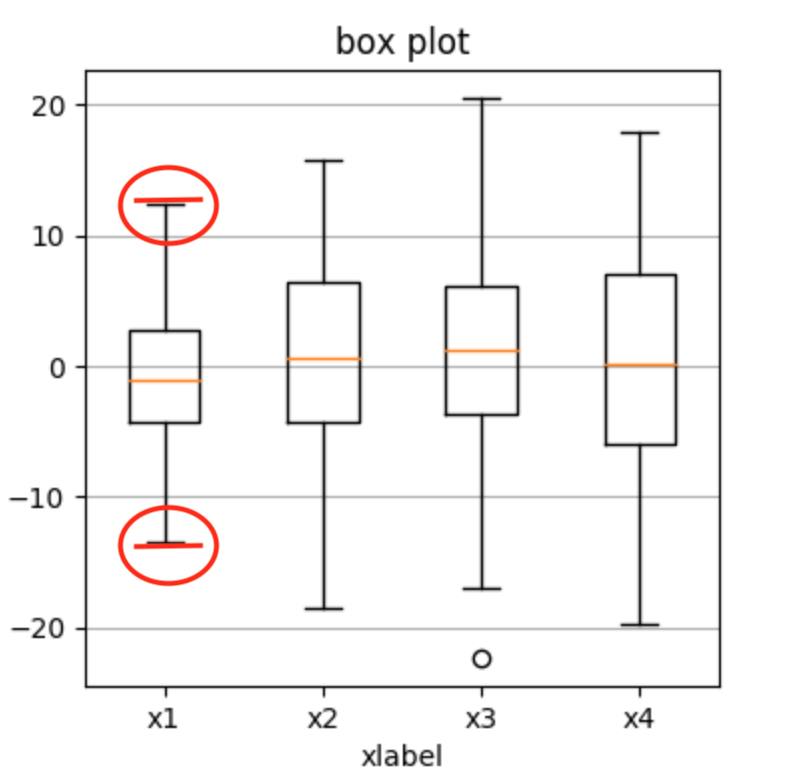
是否可以在不改变盒子大小的情况下改变晶须的最小标记和最大标记的长度?
编辑:我指的是表示晶须的最小和最大末端的线条标记的长度的增加,而不是通过增加置信区间来增加整个晶须本身的长度。在最新更新的图片中,我显示我希望增加黑色的min和max标记,使其与我用红线表示的大小相匹配。
回答 3
Stack Overflow用户
回答已采纳
发布于 2018-06-22 23:31:10
一些直接来自箱形图示例的假数据
# fake up some more data
spread = np.random.rand(50) * 100
center = np.ones(25) * 40
flier_high = np.random.rand(10) * 100 + 100
flier_low = np.random.rand(10) * -100
d2 = np.concatenate((spread, center, flier_high, flier_low), 0)
data.shape = (-1, 1)
d2.shape = (-1, 1)
# data = concatenate( (data, d2), 1 )
# Making a 2-D array only works if all the columns are the
# same length. If they are not, then use a list instead.
# This is actually more efficient because boxplot converts
# a 2-D array into a list of vectors internally anyway.
data = [data, d2, d2[::2, 0]]
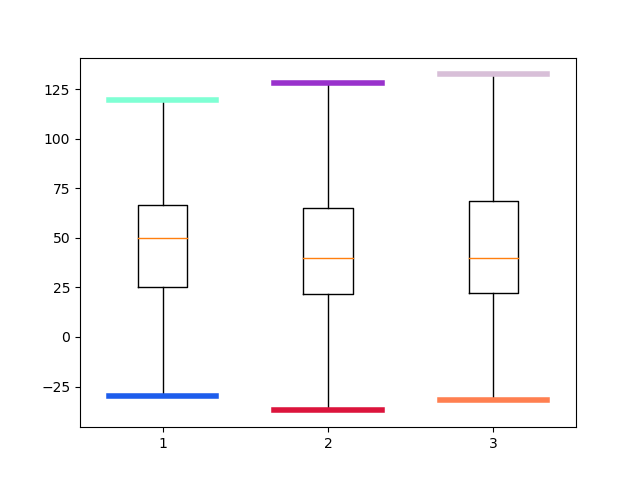
# multiple box plots on one figurepyplot.boxplot返回一个字典 of Line2D实例,caps是您想要更改的内容。这个解决方案将通过.5 x轴单元使它们更长,设置它们的颜色和线宽.
plt.figure()
returns = plt.boxplot(data, 0, '')

caps = returns['caps']
n = .25
n = .25
for cap, color in zip(caps, ['xkcd:azul','aquamarine','crimson','darkorchid','coral','thistle']):
    #print(cap.properties()['xdata'])
    #cap.set_xdata(cap.get_xdata() + (-n,+n))
    #cap.set_color(color)
    #cap.set_linewidth(4.0)
    cap.set(color=color, xdata=cap.get_xdata() + (-n,+n), linewidth=4.0)
Stack Overflow用户
发布于 2018-09-07 20:48:32
fig, axes = plt.subplots(nrows = 1, ncols = 2, figsize=(10, 5))

normal_caps = axes[0].boxplot(s, labels = ['Normal Caps'],
                capprops = dict(linestyle='-', linewidth=2, color='Black'))

big_caps = axes[1].boxplot(s, labels = ['Longer Caps'],
                capprops = dict(linestyle='-', linewidth=2, color='Black'))

for cap in big_caps['caps']:
cap.set_xdata(cap.get_xdata() + np.array([-.15,.15]))Stack Overflow用户
发布于 2018-06-22 23:11:20
在创建方框图时添加参数whis是可能的
whis : float, sequence, or string (default = 1.5)
As a float, determines the reach of the whiskers to the beyond the first and
third quartiles. In other words, where IQR is the interquartile range (Q3-Q1),
the upper whisker will extend to last datum less than Q3 + whis*IQR).
Similarly, the lower whisker will extend to the first datum greater than Q1 -
whis*IQR. Beyond the whiskers, data are considered outliers and are plotted as
individual points. Set this to an unreasonably high value to force the whiskers
to show the min and max values. Alternatively, set this to an ascending
sequence of percentile (e.g., [5, 95]) to set the whiskers at specific
percentiles of the data. Finally, whis can be the string 'range' to force the
whiskers to the min and max of the data.页面原文内容由Stack Overflow提供。腾讯云小微IT领域专用引擎提供翻译支持
原文链接:
https://stackoverflow.com/questions/50996368
复制相关文章
相似问题
腾讯云开发者

Copyright © 2013 - 2026 Tencent Cloud. All Rights Reserved. 腾讯云 版权所有
深圳市腾讯计算机系统有限公司 ICP备案/许可证号:粤B2-20090059 ![]() 粤公网安备44030502008569号
粤公网安备44030502008569号
腾讯云计算(北京)有限责任公司 京ICP证150476号 | 京ICP备11018762号