
哪种算法可以用来划分图,使每个分区组(或组件)的值相等或平衡?
哪种算法可以用来划分图,使每个分区组(或组件)的值相等或平衡?
提问于 2018-06-03 15:22:40
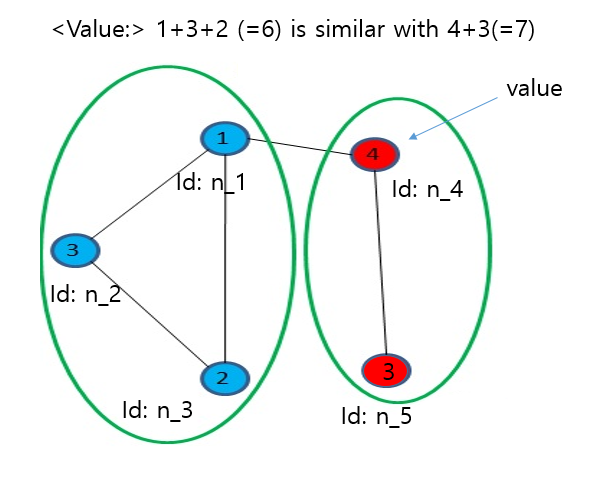
让我们假设图由具有值和无向边的节点组成。
我想将图划分为,选择作为满足每个分区组具有与节点相同的值和的条件的几个组。
你能推荐哪些算法可以用来划分图,满足我提到的条件吗?
如果您附加一个用python或java实现的算法,我将更加感激。
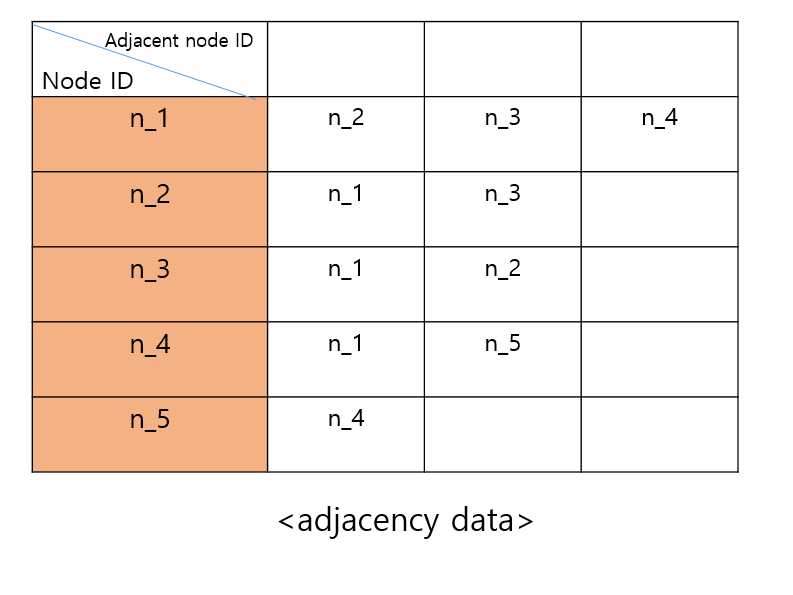
(为了您的理解,我们附上了图片和数据类型。)
<Data information>
[node_id]: n_1, n_2, n_3 ,, etc
[node_value]: 10, 5, 20,, etc
[node_adjacency_data] : Please refer to the attached picture.
[node_latitude]: 37.25201, 37.25211, 37.25219,, etc
[node_longitude]: 127.10195, 127.11321, 127.11377,, etc
回答 1
Stack Overflow用户
回答已采纳
发布于 2018-06-04 18:35:17
首先,这个问题是NP难的,所以你不能得到这个问题的完美解决方案。然而,实际上有大量的研究是为了以这种方式划分图的。从查找顶点加权图分区开始搜索。
用这种方式划分图的最著名的算法是梅蒂斯,还有一个用于优化C实现的好的Python包装器 (您必须分别构建/安装它)。它以网络图或简单的邻接列表作为输入。
METIS采用带加权顶点和边的图,并返回到给定的分区数,同时最小化被切割边的权重。您仍然需要选择要将图形分解成多少个部分。
下面是一些使用Python库解决示例问题的示例代码:
import networkx as nx
import metis

# Set up graph structure
G = nx.Graph()
G.add_edges_from([ (0,1), (0,2), (0,3), (1, 2), (3, 4) ])

# Add node weights to graph
for i, value in enumerate([1,3,2,4,3]):
    G.node[i]['node_value'] = value

# tell METIS which node attribute to use for
G.graph['node_weight_attr'] = 'node_value'

# Get at MOST two partitions from METIS
(cut, parts) = metis.part_graph(G, 2)
# parts == [0, 0, 0, 1, 1]

# Assuming you have PyDot installed, produce a DOT description of the graph:
colors = ['red', 'blue']
for i, part in enumerate(parts):
    G.node[i]['color'] = colors[part]
nx.nx_pydot.write_dot(G, 'example.dot')
然后,我们可以使用GraphViz来可视化分区:
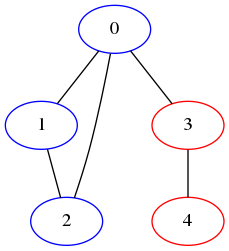
这和你在问题中给出的分区是一样的。
页面原文内容由Stack Overflow提供。腾讯云小微IT领域专用引擎提供翻译支持
原文链接:
https://stackoverflow.com/questions/50667961
复制相关文章
相似问题
腾讯云开发者

Copyright © 2013 - 2026 Tencent Cloud. All Rights Reserved. 腾讯云 版权所有
深圳市腾讯计算机系统有限公司 ICP备案/许可证号:粤B2-20090059  粤公网安备44030502008569号
腾讯云计算(北京)有限责任公司 京ICP证150476号 | 京ICP备11018762号