
matplotlib PGF输出:轮廓标签超出图形边界
matplotlib PGF输出:轮廓标签超出图形边界
提问于 2018-05-27 17:41:01
以 examples page的第一个例子为例,
import matplotlib
import numpy as np
import matplotlib.cm as cm
import matplotlib.mlab as mlab
import matplotlib.pyplot as plt

matplotlib.rcParams['xtick.direction'] = 'out'
matplotlib.rcParams['ytick.direction'] = 'out'

delta = 0.025
x = np.arange(-3.0, 3.0, delta)
y = np.arange(-2.0, 2.0, delta)
X, Y = np.meshgrid(x, y)
Z1 = mlab.bivariate_normal(X, Y, 1.0, 1.0, 0.0, 0.0)
Z2 = mlab.bivariate_normal(X, Y, 1.5, 0.5, 1, 1)
# difference of Gaussians
Z = 10.0 * (Z2 - Z1)


# Create a simple contour plot with labels using default colors.  The
# inline argument to clabel will control whether the labels are draw
# over the line segments of the contour, removing the lines beneath
# the label
plt.figure()
CS = plt.contour(X, Y, Z)
plt.clabel(CS, inline=1, fontsize=10)
plt.title('Simplest default with labels')

plt.savefig('plot.pgf')
我有一个问题,轮廓标签靠近轴(在这里,“0.000”在最上面)突出超出图形边界。下面是我使用LaTeX获得的输出:
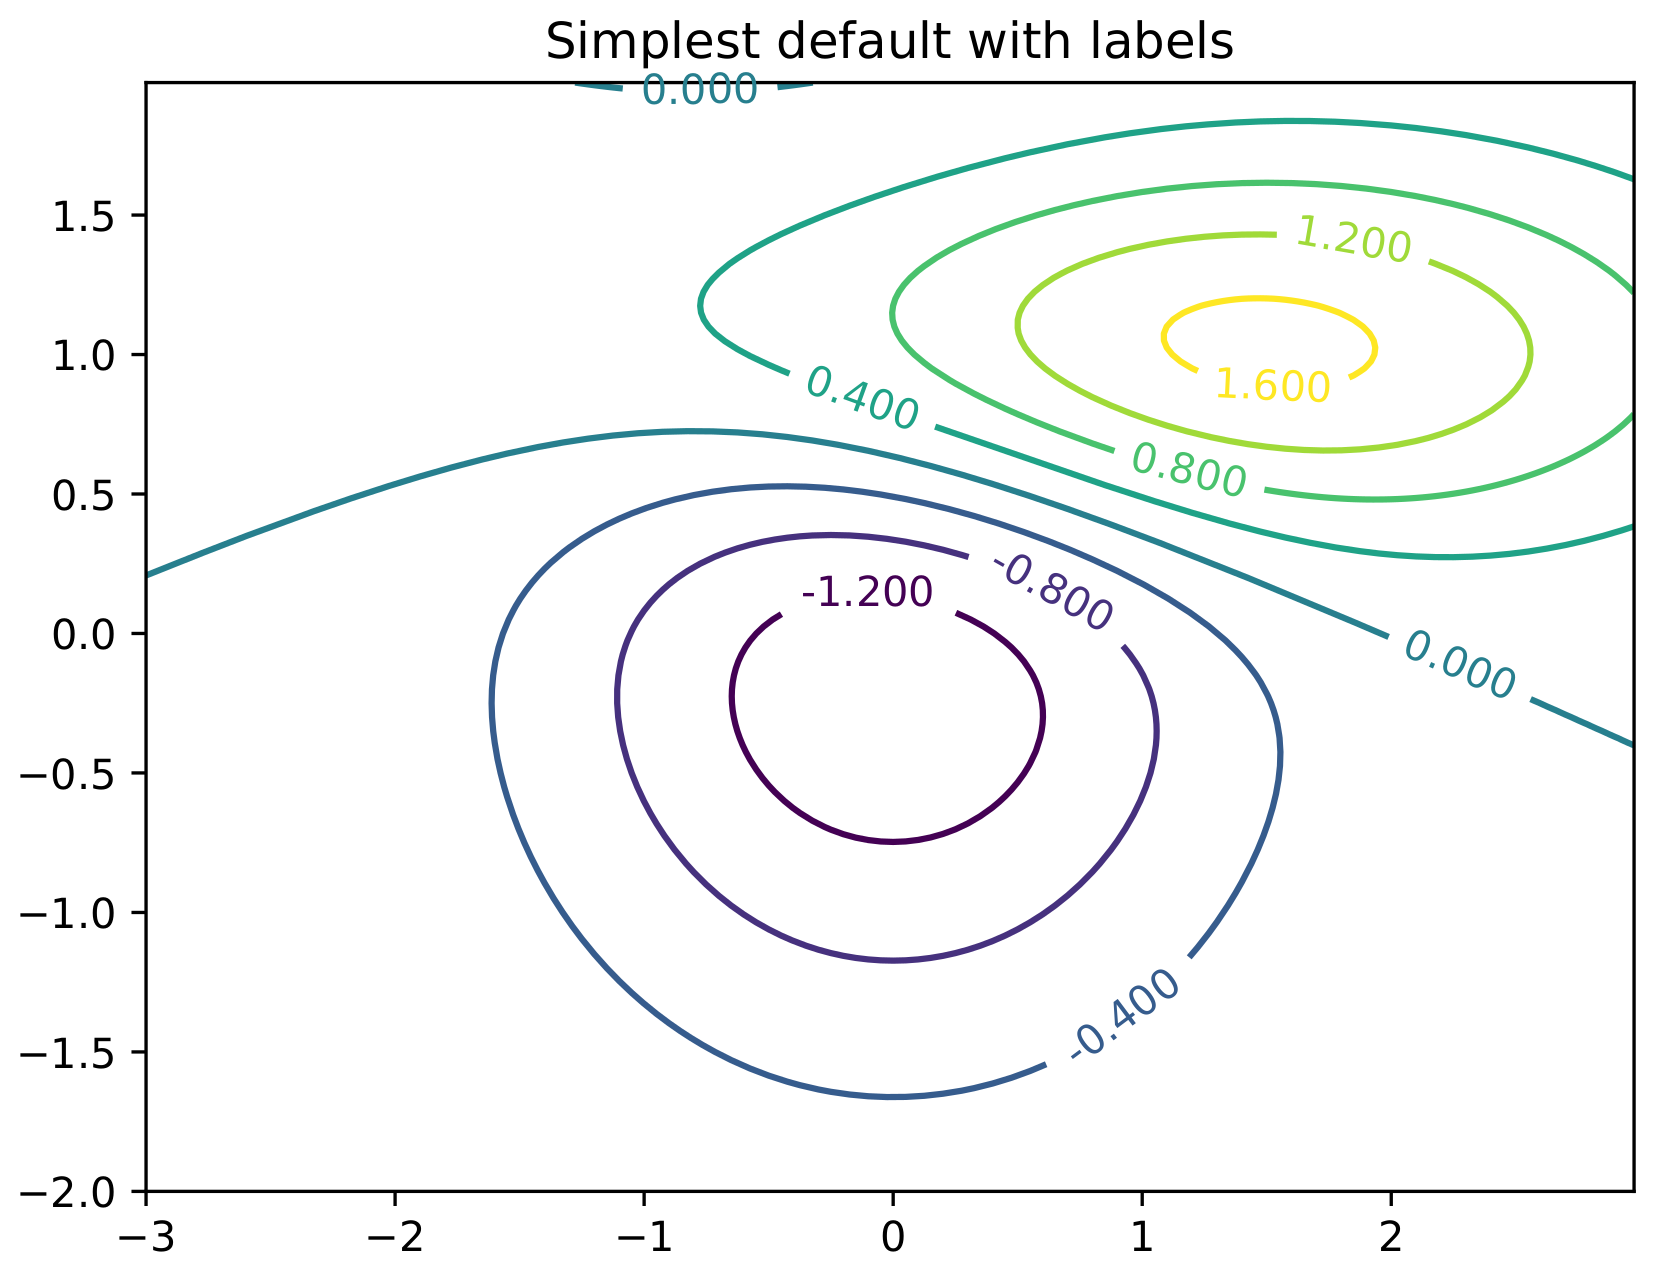
如您所见,顶部的标签“0.000”与黑线重叠。
我能做些什么来解决这个问题吗?要明确的是,我的问题不是标签接近轴。我想要的是与 page相同的行为,即将情节内容剪裁到图形区域,切断文本和行。
回答 1
Stack Overflow用户
回答已采纳
发布于 2021-05-14 16:19:13
正如 (#11375)所示,matplotlib的PGF后端不支持文本裁剪,这是导致这个问题的原因,而这个问题今天似乎仍然存在。
页面原文内容由Stack Overflow提供。腾讯云小微IT领域专用引擎提供翻译支持
原文链接:
https://stackoverflow.com/questions/50554835
复制相关文章
相似问题
腾讯云开发者

Copyright © 2013 - 2026 Tencent Cloud. All Rights Reserved. 腾讯云 版权所有
深圳市腾讯计算机系统有限公司 ICP备案/许可证号:粤B2-20090059 ![]() 粤公网安备44030502008569号
粤公网安备44030502008569号
腾讯云计算(北京)有限责任公司 京ICP证150476号 | 京ICP备11018762号