
web映像:来自计算机的自定义映像,而不是来自web的自定义图像。
web映像:来自计算机的自定义映像,而不是来自web的自定义图像。
提问于 2018-05-26 18:57:44
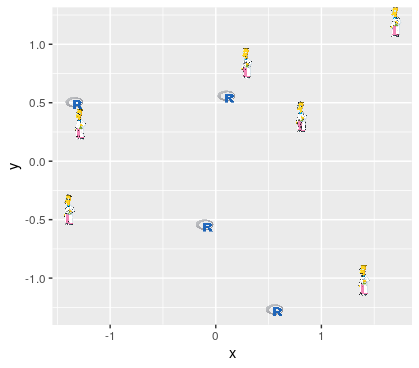
下面的图表可以根据下面给出的R代码生成。图中使用的图像是从网站获取的。我想知道如何使用计算机上的图像。
library("ggplot2")
library("ggimage")

set.seed(2017-02-21)
d <- data.frame(x = rnorm(10),
                y = rnorm(10),
                image = sample(c("https://www.r-project.org/logo/Rlogo.png",
                                 "https://jeroenooms.github.io/images/frink.png"),
                               size=10, replace = TRUE)
                )

ggplot(d, aes(x, y)) + geom_image(aes(image=image), size=.05)回答 1
Stack Overflow用户
回答已采纳
发布于 2018-05-26 19:08:06
非常简单,您只需设置保存要使用的.png文件的目录:
library("ggplot2")
library("ggimage")
set.seed(2017-02-21)
d <- data.frame(x = rnorm(10),
                y = rnorm(10),
                image = sample(c("C:/YourDirectory/juventus.png",
                                 "C:/YourDirectory/sampdoria.png"),
                               size=10, replace = TRUE)
)

ggplot(d, aes(x, y)) + geom_image(aes(image=image), size=.05)
你得到的结果如下:

页面原文内容由Stack Overflow提供。腾讯云小微IT领域专用引擎提供翻译支持
原文链接:
https://stackoverflow.com/questions/50546109
复制相关文章
相似问题
腾讯云开发者

Copyright © 2013 - 2026 Tencent Cloud. All Rights Reserved. 腾讯云 版权所有
深圳市腾讯计算机系统有限公司 ICP备案/许可证号:粤B2-20090059 ![]() 粤公网安备44030502008569号
粤公网安备44030502008569号
腾讯云计算(北京)有限责任公司 京ICP证150476号 | 京ICP备11018762号