
如何用matlab绘制曲面?
如何用matlab绘制曲面?
提问于 2018-05-25 19:48:14
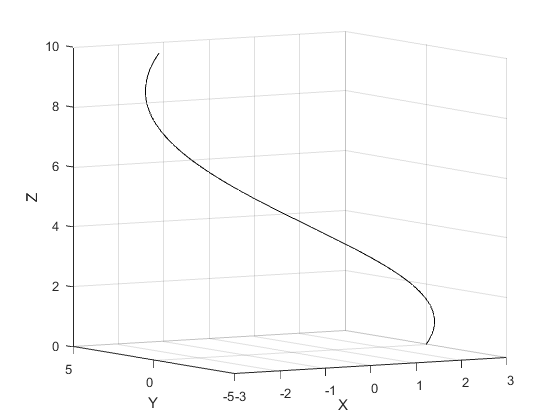
我试着用管子做一个切割,我想要做一个曲面来表示管子的外部。然而,当我绘制曲面时,我只得到曲面的对角线,而不是曲面本身。我怎么才能解决这个问题?
MWE:
r = 0:0.1:3;
z = 0:0.1:10;
[rr, zz] = meshgrid(r,z);

% set cut planes angles
theta1 = 0;
theta2 = pi*135/180;
nt = 101;  % angle resolution

figure(1);
clf;

t3 = linspace(theta1, (theta2 - 2*pi), nt);
[rr3, tt3] = meshgrid(r,t3);

% Create curved surface
xx5 = r(end) * cos(tt3);
yy5 = r(end) * sin(tt3);
h5 = surface(xx5, yy5,zz)回答 2
Stack Overflow用户
回答已采纳
发布于 2018-05-26 06:19:29
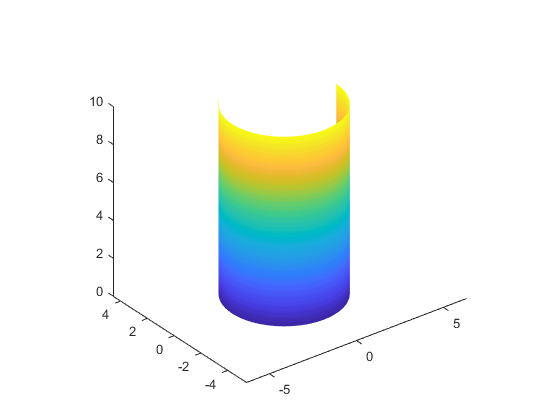
你创建的网格是基于θ和半径的。然而,半径对于管道外部是恒定的,所以它应该基于θ和z,因为这是定义网格的两个独立变量。基于这个理由,我相信以下是你想要的。
r = 0:0.1:3;
z = 0:0.1:10;

% set cut planes angles
theta1 = 0;
theta2 = pi*135/180;
nt = 101;  % angle resolution

figure(1);
clf;

% create a grid over theta and z
t3 = linspace(theta1, (theta2 - 2*pi), nt);
[tt3, zz3] = meshgrid(t3, z);
% convert from cylindical to Cartesian coordinates
xx5 = r(end) * cos(tt3);
yy5 = r(end) * sin(tt3);
% plot surface
h5 = surface(xx5, yy5, zz3, 'EdgeColor', 'none');

% extra stuff to make plot prettier
axis vis3d
axis equal
view(3)
camzoom(0.7);
Stack Overflow用户
发布于 2018-05-25 20:29:20
尝试使用surf和surf(xx5, yy5, zz)。这就是你要找的吗?
页面原文内容由Stack Overflow提供。腾讯云小微IT领域专用引擎提供翻译支持
原文链接:
https://stackoverflow.com/questions/50535958
复制相关文章
相似问题
腾讯云开发者

Copyright © 2013 - 2026 Tencent Cloud. All Rights Reserved. 腾讯云 版权所有
深圳市腾讯计算机系统有限公司 ICP备案/许可证号:粤B2-20090059 ![]() 粤公网安备44030502008569号
粤公网安备44030502008569号
腾讯云计算(北京)有限责任公司 京ICP证150476号 | 京ICP备11018762号