
把计数加到ggmosaic中,这能做得更简单吗?
把计数加到ggmosaic中,这能做得更简单吗?
提问于 2018-05-08 07:12:39
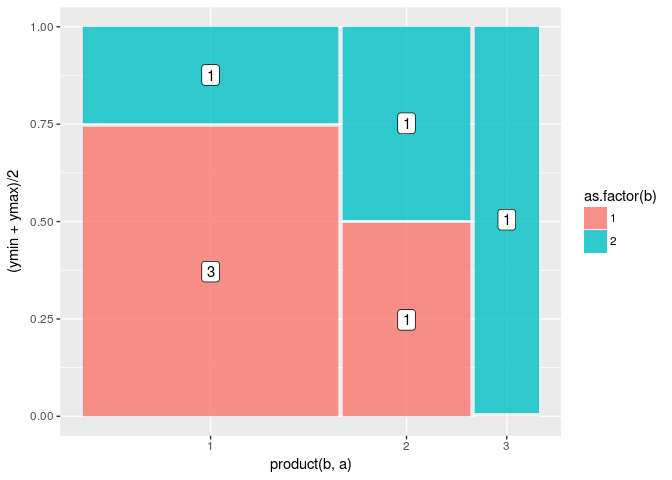
我想使用ggmosaic包制作一个马赛克图,并添加计数,如下面的示例所示。
这个例子很管用,但我发现代码的结构很难看。对于我如何改进代码,使其更可重用,您有什么建议吗?
特别是需要将早期版本的绘图存储在临时变量中,这与使用ggplot2通常可以实现的目标相比似乎是错误的。
library(tidyverse)
library(ggmosaic)
#> Indlæser krævet pakke: productplots
#>
#> Vedhæfter pakke: 'ggmosaic'
#> De følgende objekter er maskerede fra 'package:productplots':
#>
#>     ddecker, hspine, mosaic, prodcalc, spine, vspine

data <- tribble(~a, ~b,
                1, 1,
                1, 1,
                1, 1,
                1, 2,
                2, 1,
                2, 2,
                3, 2)

p <- ggplot(data) +
  geom_mosaic(aes(x=product(b, a), fill=as.factor(b)))

p +
  geom_label(data = ggplot_build(p)$data %>% as.data.frame() %>% filter(.wt > 0),
             aes(x = (xmin + xmax)/2,
                 y = (ymin + ymax)/2,
                 label = .wt))
由reprex封装创建于2018-05-08 (v0.2.0)。
回答 2
Stack Overflow用户
回答已采纳
发布于 2022-05-10 12:42:55
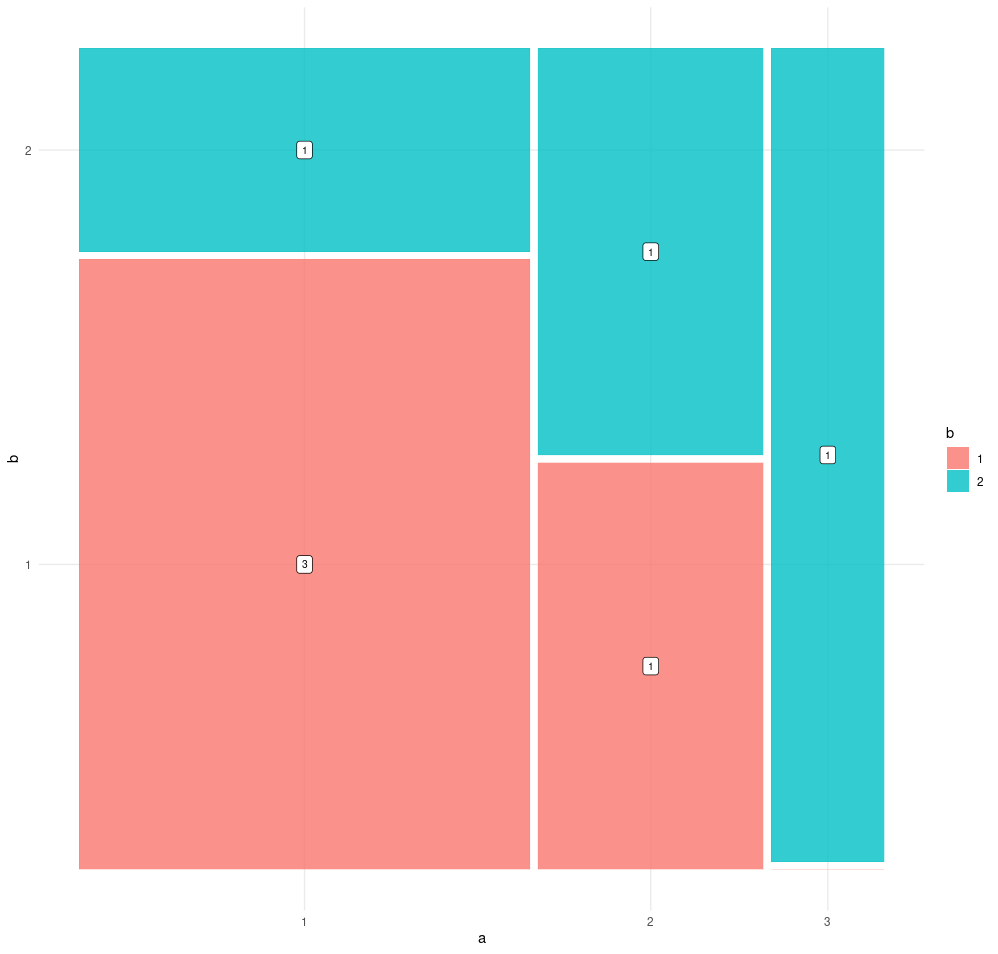
这可以通过使用ggmosaic包内建标签功能的一行代码来完成。
为此,我们只需添加geom_mosaic_text()层:
data <- tribble(~a, ~b,
                1, 1,
                1, 1,
                1, 1,
                1, 2,
                2, 1,
                2, 2,
                3, 2) %>%
  mutate(across(c(a, b), as.factor))

ggplot(data) +
  geom_mosaic(aes(x=product(b, a), fill=b)) +
  geom_mosaic_text(aes(x = product(b, a), label = after_stat(.wt)), as.label=TRUE)
Stack Overflow用户
发布于 2018-05-08 09:53:04
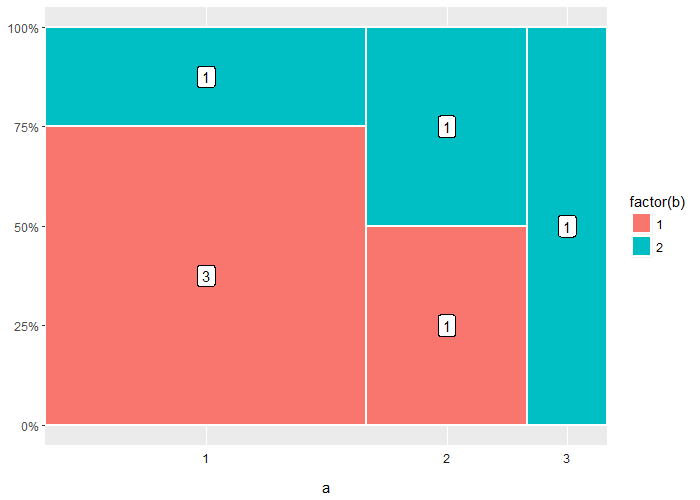
我的之前在纯ggplot2中制作了类似的图表,而没有使用ggmosaic。不过,我不知道这是否足以满足您的用例要求:
# data manipulation
data %>%
  group_by(a, b) %>%
  summarise(n = n()) %>%
  mutate(x.width = sum(n)) %>%

  # simulate mosaic plot
  ggplot(aes(x = factor(a), y = n)) +
  geom_col(aes(width = x.width, fill = factor(b)),
           colour = "white", size = 1, position = position_fill(reverse = TRUE)) +
  geom_label(aes(label = n),
             position = position_fill(vjust = 0.5)) +
  facet_grid(~ a, space = "free", scales = "free", switch = "x") +

  # cosmetic tweaks
  scale_x_discrete(name = "a") +
  scale_y_continuous(labels = scales::percent) +
  theme(axis.text.x = element_blank(),
        axis.ticks.x = element_blank(),
        axis.title.y = element_blank(),
        strip.background = element_blank(),
        panel.spacing = unit(0, "pt"))
页面原文内容由Stack Overflow提供。腾讯云小微IT领域专用引擎提供翻译支持
原文链接:
https://stackoverflow.com/questions/50227916
复制相关文章
相似问题
腾讯云开发者

Copyright © 2013 - 2026 Tencent Cloud. All Rights Reserved. 腾讯云 版权所有
深圳市腾讯计算机系统有限公司 ICP备案/许可证号:粤B2-20090059 ![]() 粤公网安备44030502008569号
粤公网安备44030502008569号
腾讯云计算(北京)有限责任公司 京ICP证150476号 | 京ICP备11018762号