
jupyterlab交互图
jupyterlab交互图
提问于 2018-05-03 07:45:31
使用旧的木星笔记本,我可以通过以下方式创建交互式情节:
import matplotlib.pyplot as plt
%matplotlib notebook
x = [1,2,3]
y = [4,5,6]
plt.figure()
plt.plot(x,y)
但是,在JupyterLab中,这会产生一个错误:
JavaScript output is disabled in JupyterLab我也尝试过这种魔力(安装了jupyter-matplotlib ):
%matplotlib ipympl但这只是回报:
FigureCanvasNbAgg()内联绘图工作,但它们不是交互式情节:
%matplotlib inline回答 6
Stack Overflow用户
回答已采纳
发布于 2018-05-09 06:55:27
根据乔治的建议,这是由于没有安装Node.js造成的。
Stack Overflow用户
发布于 2019-04-25 11:41:50
JupyterLab 3.0+
- 安装
jupyterlab和ipympl。 对于pip用户: pip安装-升级jupyterlab ipympl 对于conda用户: conda更新-c conda-伪造jupyterlab ipympl - 重新启动JupyterLab。
- 用标题装饰包含绘图代码的单元格: %matplotlib小部件#绘图代码在这里
JupyterLab 2.0
- 安装
nodejs,例如conda install -c conda-forge nodejs。 - 安装
ipympl,例如conda install -c conda-forge ipympl。 - 可选,但建议。更新JupyterLab,例如:
conda update -c conda-forge jupyterlab==2.2.9==py_0。 - 可选,但建议。对于本地用户安装,请运行:
export JUPYTERLAB_DIR="$HOME/.local/share/jupyter/lab"。 - 安装扩展: 安装@ jupyter -widget/jupyterlab-manager jupyter labextension jupyter-matplotlib
- 启用小部件:
jupyter nbextension enable --py widgetsnbextension。 - 重新启动JupyterLab。
- 用
%matplotlib widget装饰。
Stack Overflow用户
发布于 2018-09-24 20:42:45
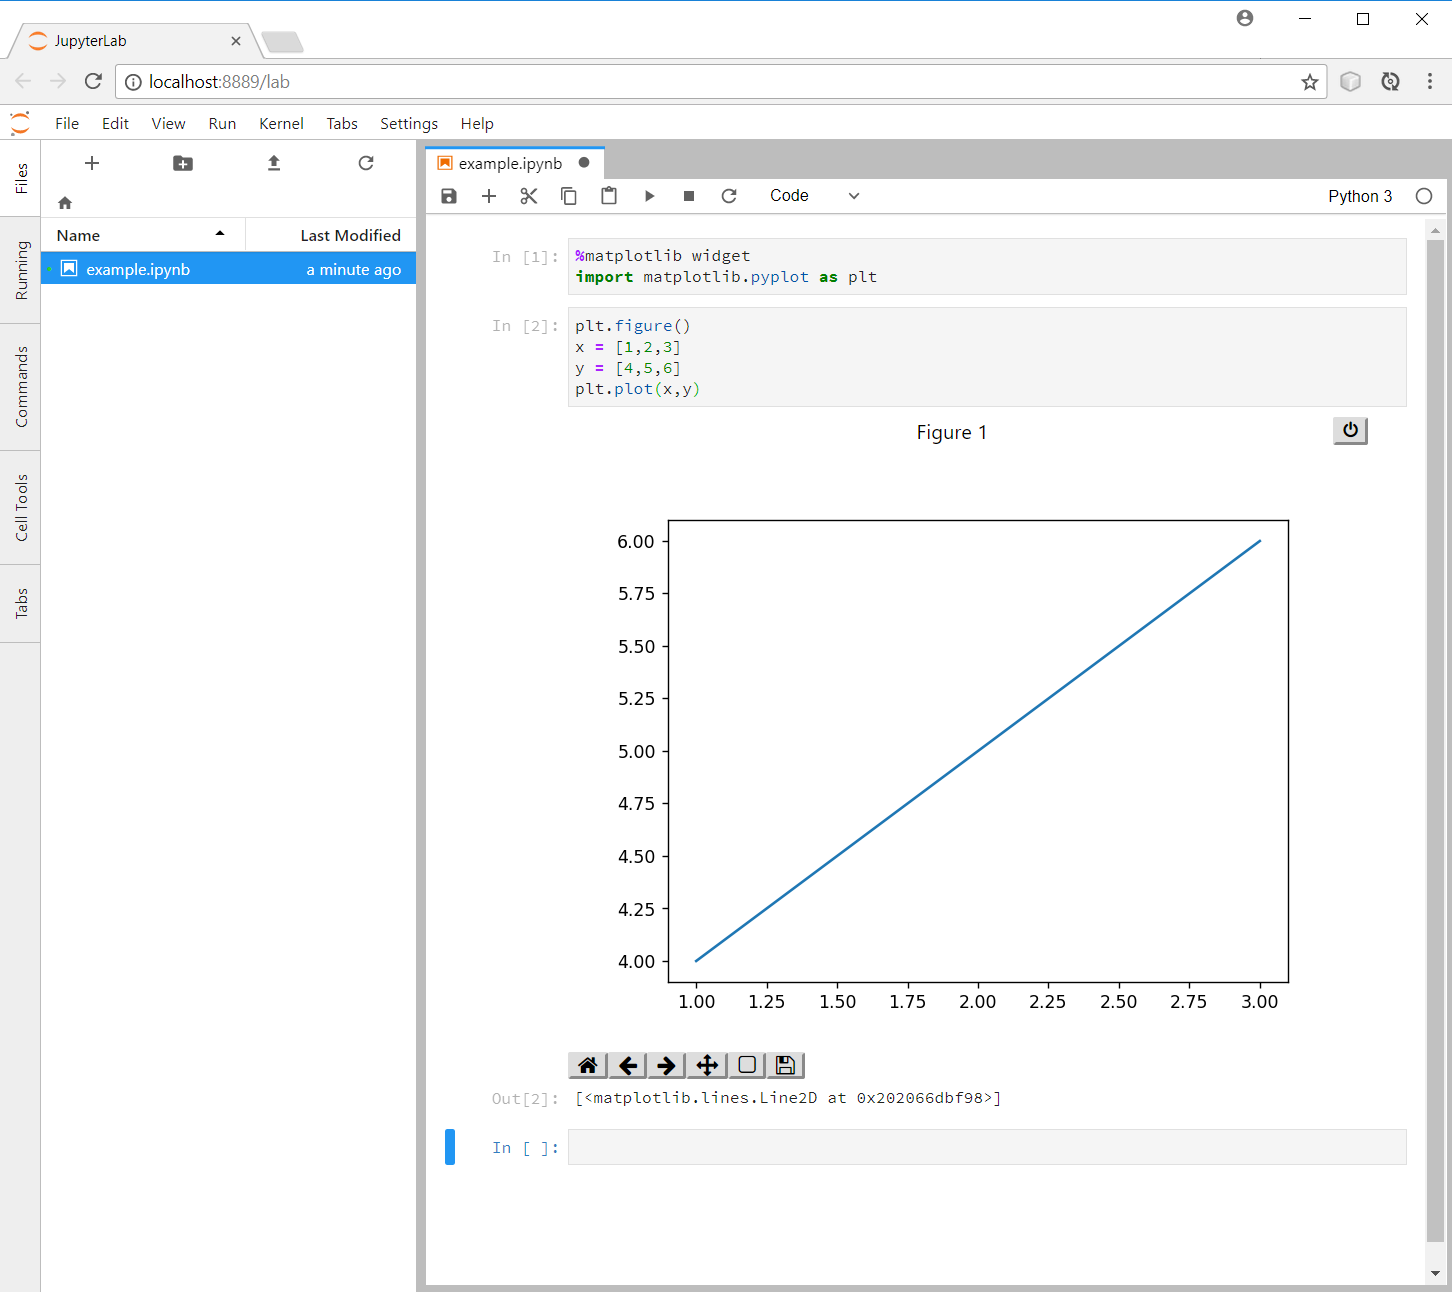
要启用jupyter-matplotlib后端,请使用matplotlib木星魔术:
%matplotlib widget
import matplotlib.pyplot as plt
plt.figure()
x = [1,2,3]
y = [4,5,6]
plt.plot(x,y)更多信息请访问GitHub上的jupyter-matplotlib
页面原文内容由Stack Overflow提供。腾讯云小微IT领域专用引擎提供翻译支持
原文链接:
https://stackoverflow.com/questions/50149562
复制相关文章
相似问题
腾讯云开发者

Copyright © 2013 - 2026 Tencent Cloud. All Rights Reserved. 腾讯云 版权所有
深圳市腾讯计算机系统有限公司 ICP备案/许可证号:粤B2-20090059 ![]() 粤公网安备44030502008569号
粤公网安备44030502008569号
腾讯云计算(北京)有限责任公司 京ICP证150476号 | 京ICP备11018762号