
R svgPanZoom在shinyApp中的显示方式与shinyApp和Rstudio不同
R svgPanZoom在shinyApp中的显示方式与shinyApp和Rstudio不同
提问于 2018-04-29 03:06:21
我用R绘制了一幅svgPanZoom、svglite、ggplot2和闪亮包的图片。但是,它可以在Rstudio上正确显示,但不能在Web上显示。有什么解决办法吗?请运行以下代码以获得详细信息。
library(shiny)
library(svglite)
library(svgPanZoom)
library(ggplot2)

data<-data.frame(x=1:50,y=1:50)
x_position<-1:50
y_position<-1:50
ui <- pageWithSidebar(
  headerPanel(""),
  sidebarPanel(),
  mainPanel(

    column(width=12,svgPanZoomOutput(outputId = "main_plot",width=600,height=450))

))

server = shinyServer(function(input, output) {
  output$main_plot <- renderSvgPanZoom({
    p <- ggplot(data, aes(x = x, y = y)) + geom_point()

    svgPanZoom(
      svglite:::inlineSVG(show(p))
      , controlIconsEnabled = T)
  })
})

shinyApp(ui,server)
R工作室:
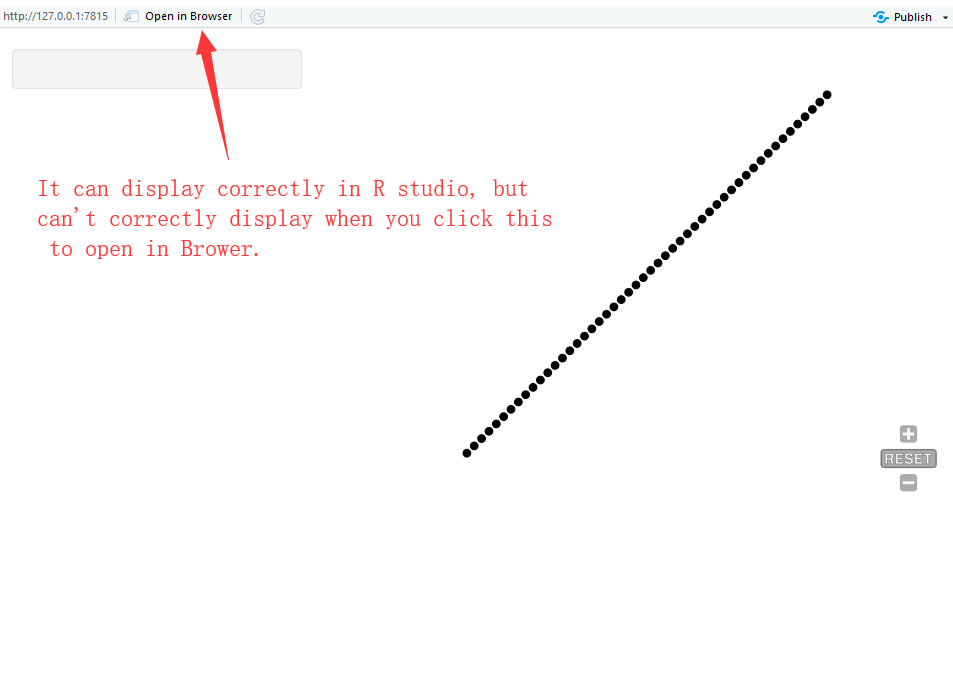
网站:

回答 2
Stack Overflow用户
回答已采纳
发布于 2018-05-03 09:27:36
最后,我尝试了包"SVGAnnotation“,幸运地解决了这个问题。
Stack Overflow用户
发布于 2019-01-31 09:54:54
我也有类似的问题,很容易就解决了。这里是ui.R的片段:
svgPanZoomOutput(outputId = "betaPlot", height = "800px")和服务器。
p = ggplot(blah blah)

    svgPanZoom(
  svglite::stringSVG(print(p), standalone = F),
  controlIconsEnabled = T, viewBox = FALSE
)
外部浏览器需要的是viewBox = FALSE,您需要在ui.R中调整图形的高度,否则控件就不会显示。
显然,加载库(Svglite)和库(SvgPanZoom)
不管怎么说,这对我来说很管用
页面原文内容由Stack Overflow提供。腾讯云小微IT领域专用引擎提供翻译支持
原文链接:
https://stackoverflow.com/questions/50083003
复制相关文章
相似问题
腾讯云开发者

Copyright © 2013 - 2026 Tencent Cloud. All Rights Reserved. 腾讯云 版权所有
深圳市腾讯计算机系统有限公司 ICP备案/许可证号:粤B2-20090059 ![]() 粤公网安备44030502008569号
粤公网安备44030502008569号
腾讯云计算(北京)有限责任公司 京ICP证150476号 | 京ICP备11018762号